
| Instrument | Positioning %ile | Wk over Wk | Positioning Regime |
|---|---|---|---|
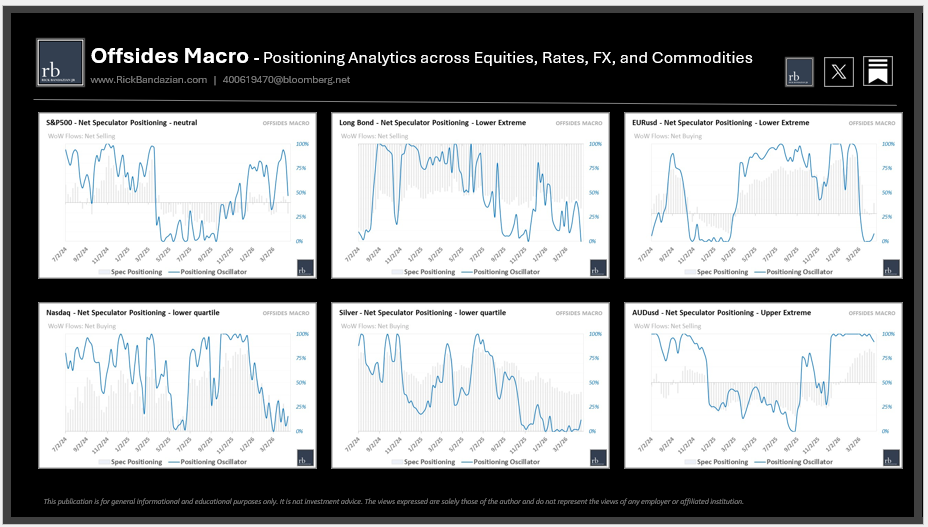
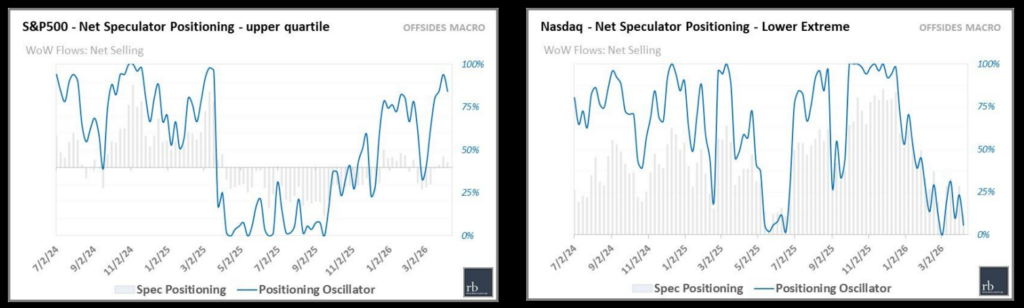
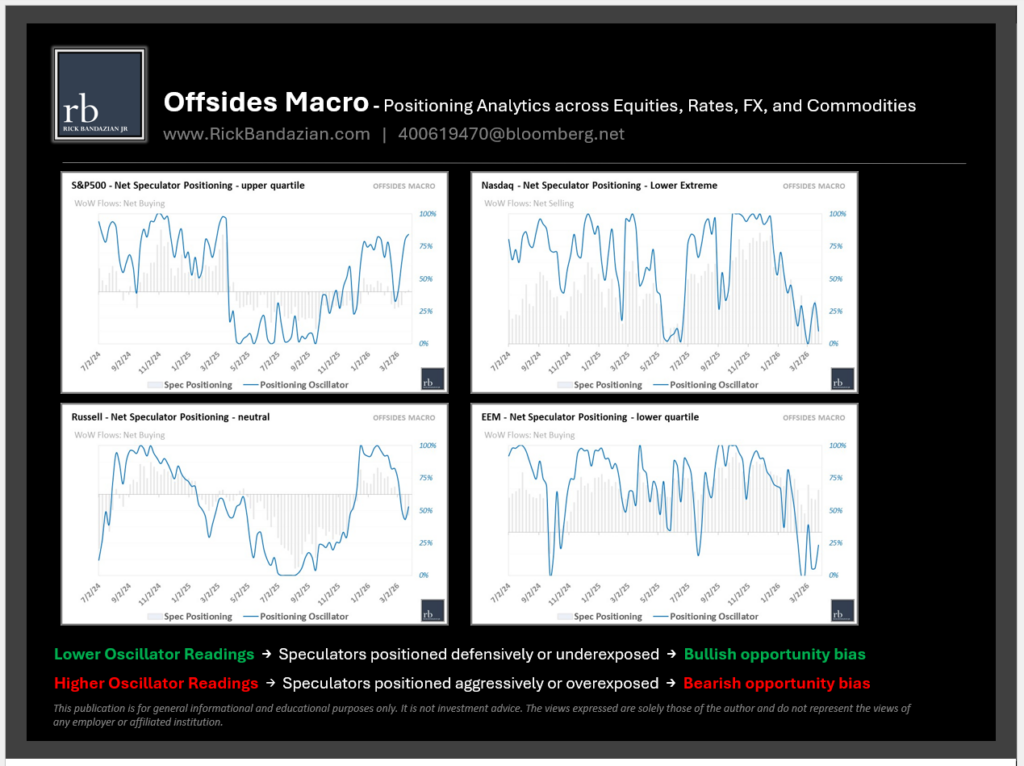
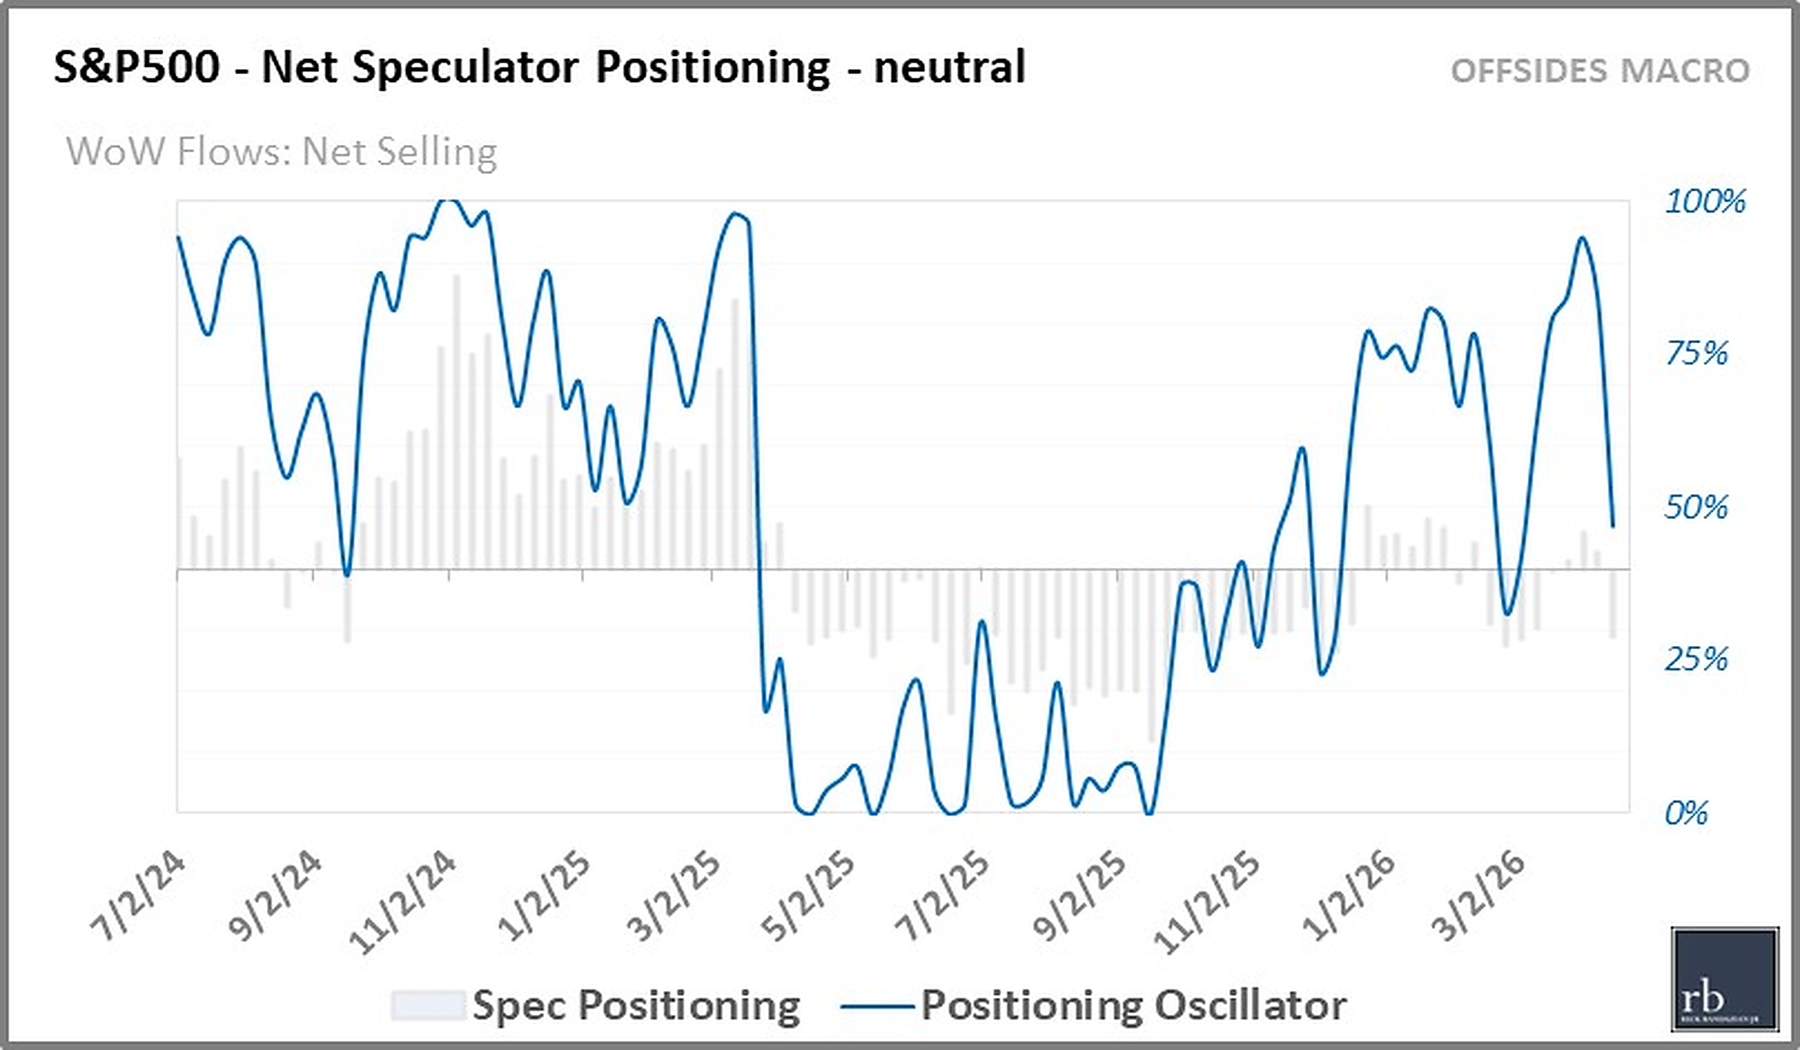
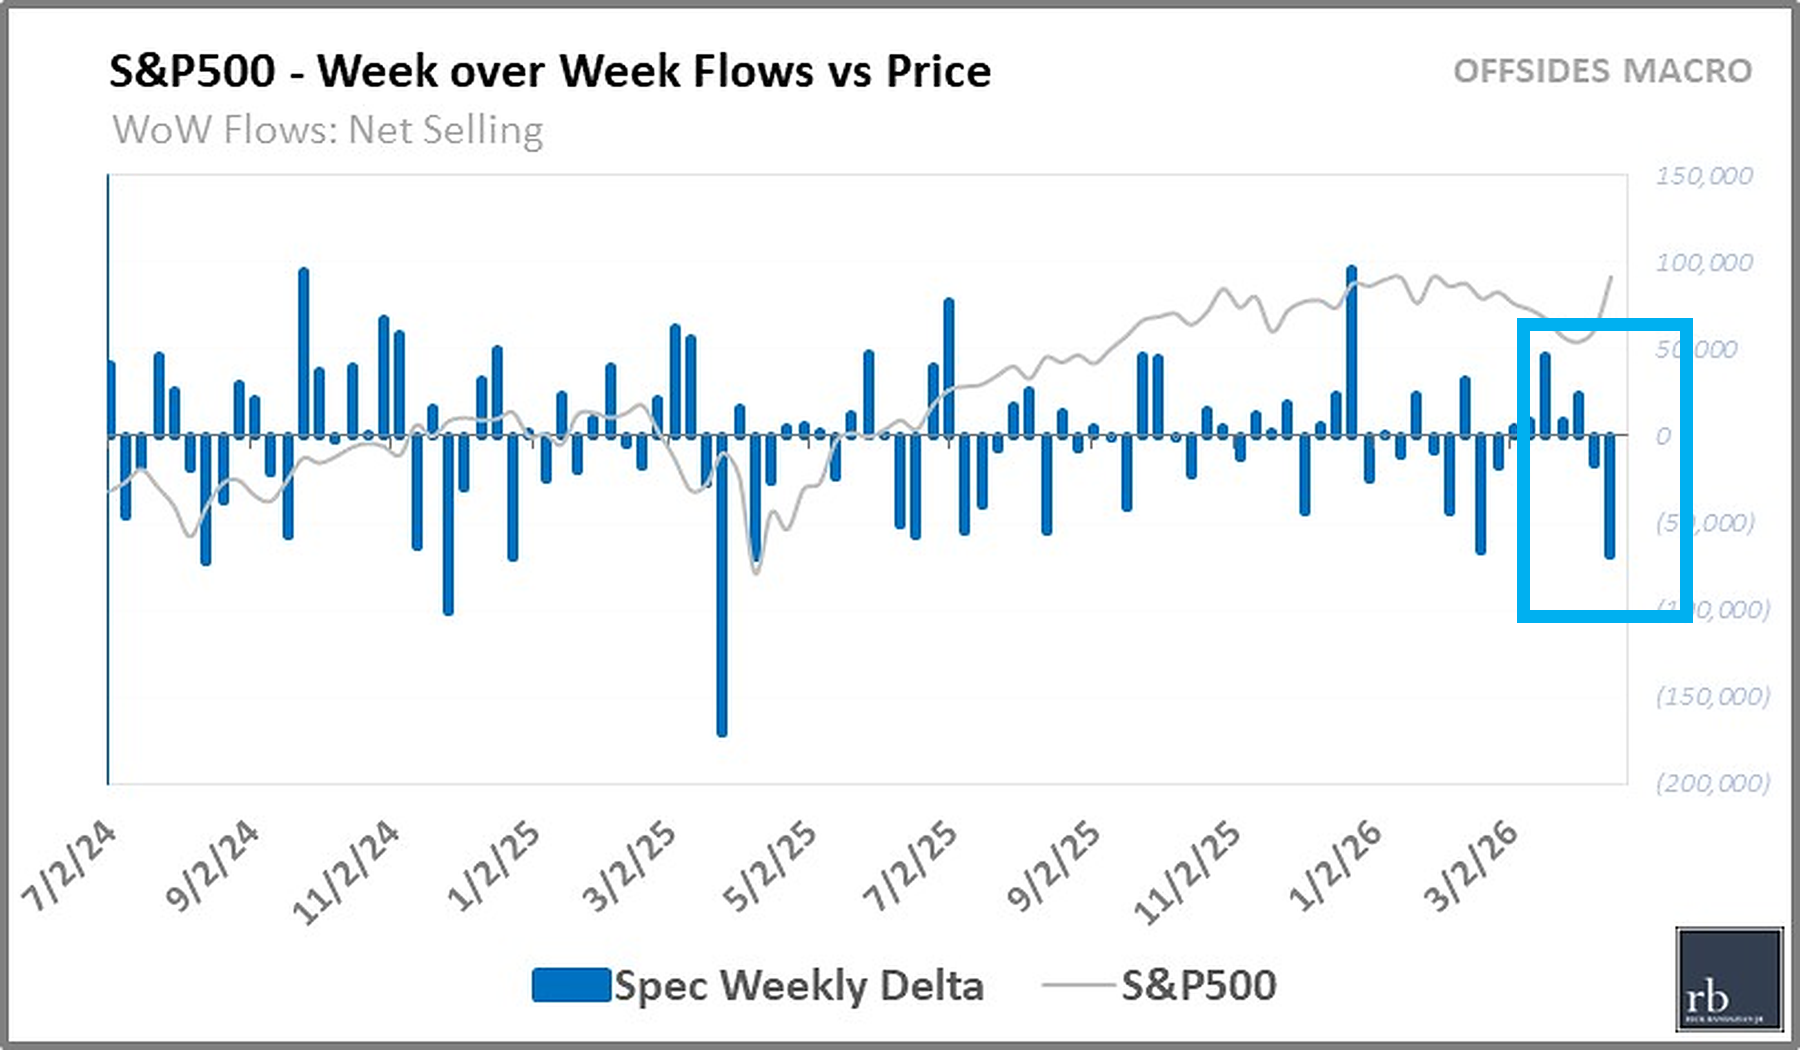
| S&P500 | 47%ile | ▼ | Neutral |
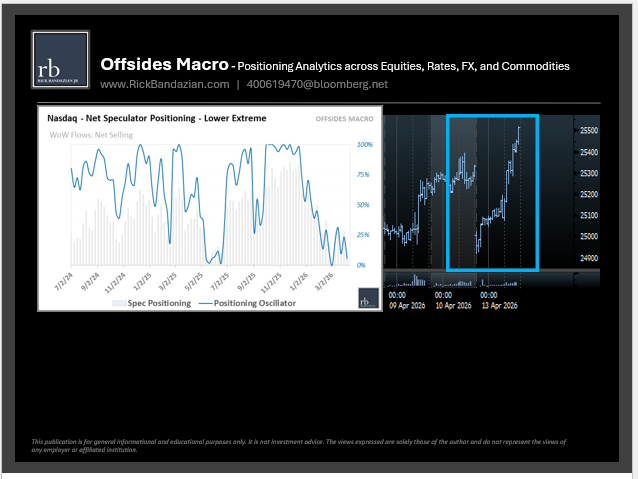
| Nasdaq | 16%ile | ▲ | Lower Quartile |
| Russell | 73%ile | ▲ | Neutral |
| Dow | 46%ile | ▲ | Neutral |
| EEM | 0%ile | ▼ | Lower Extreme |
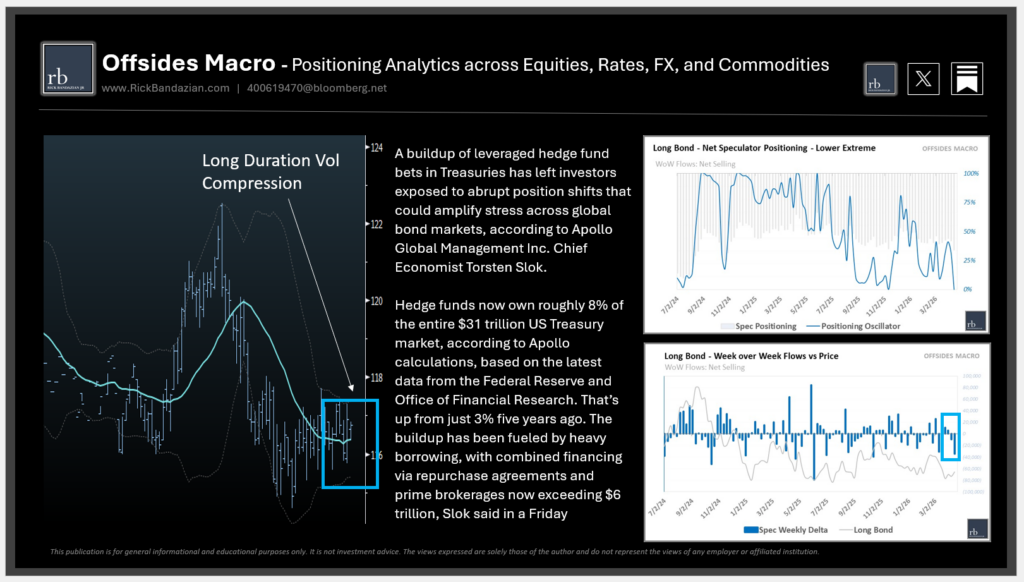
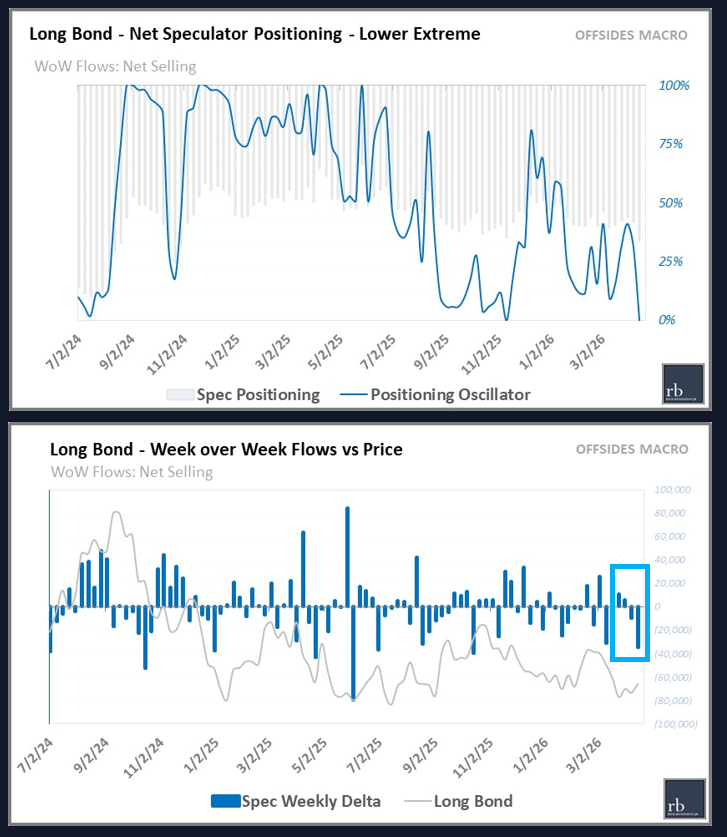
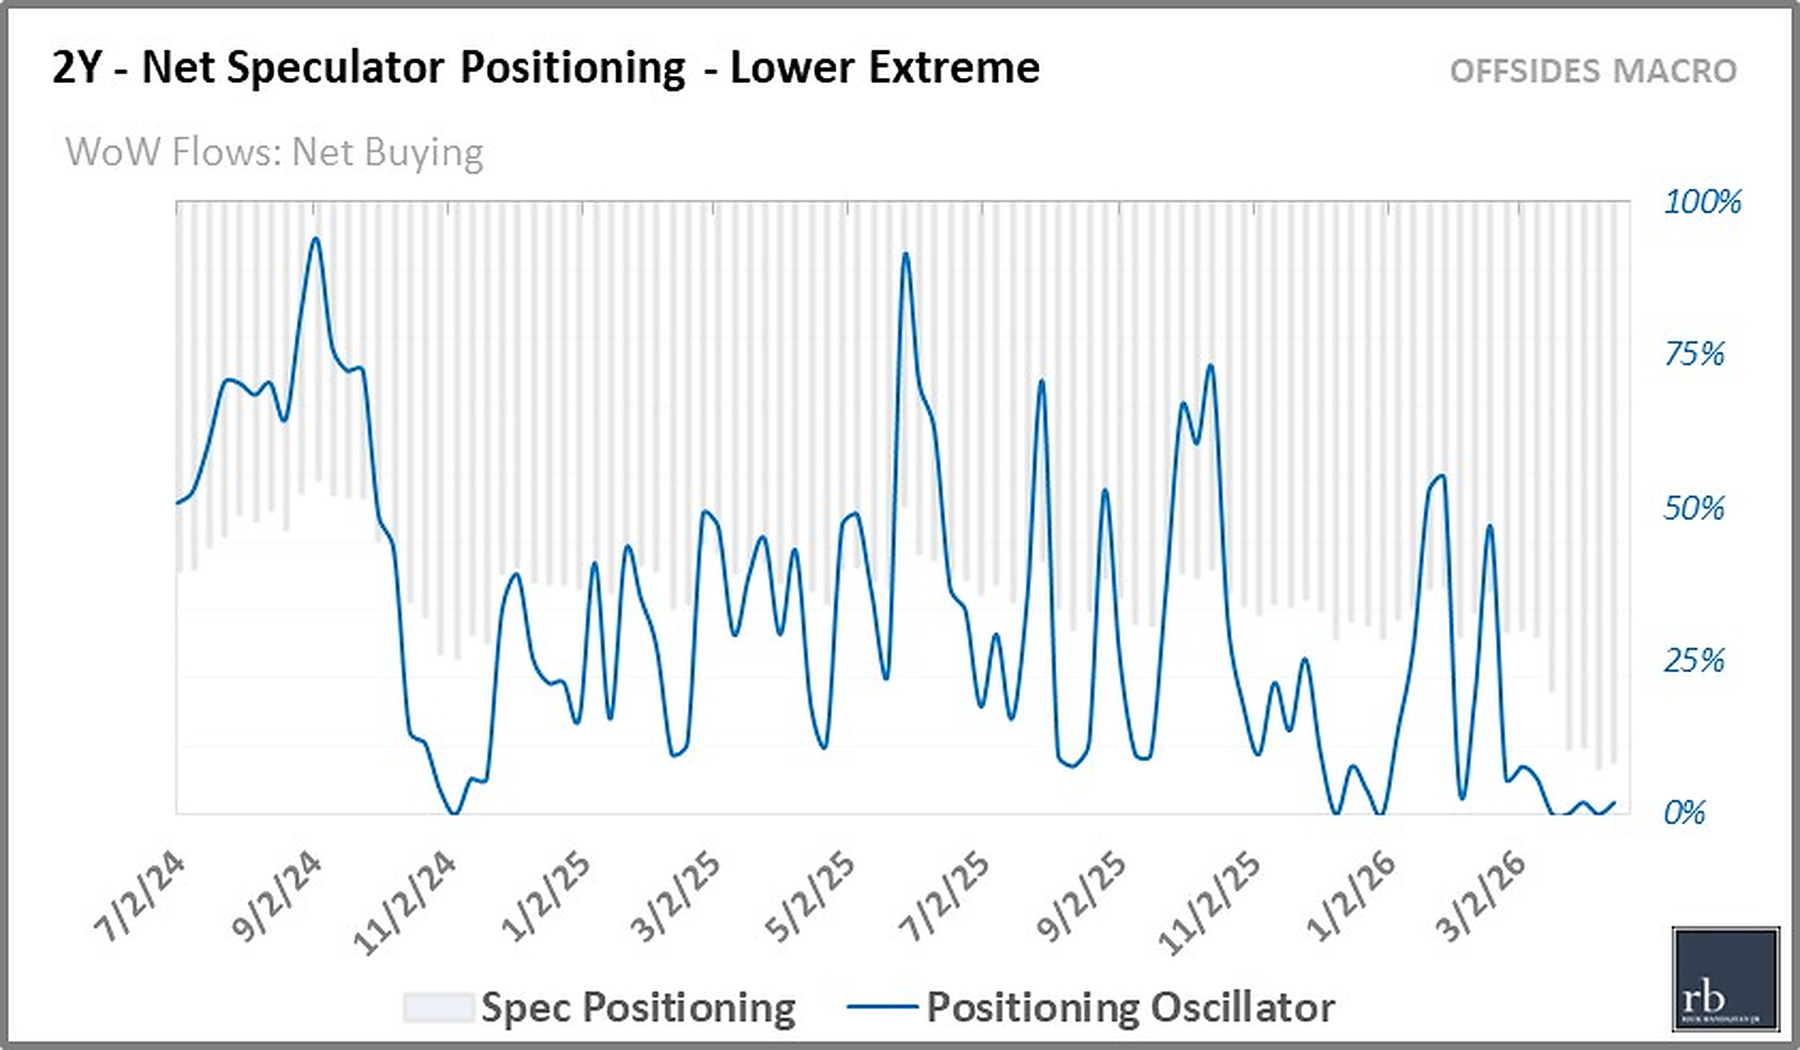
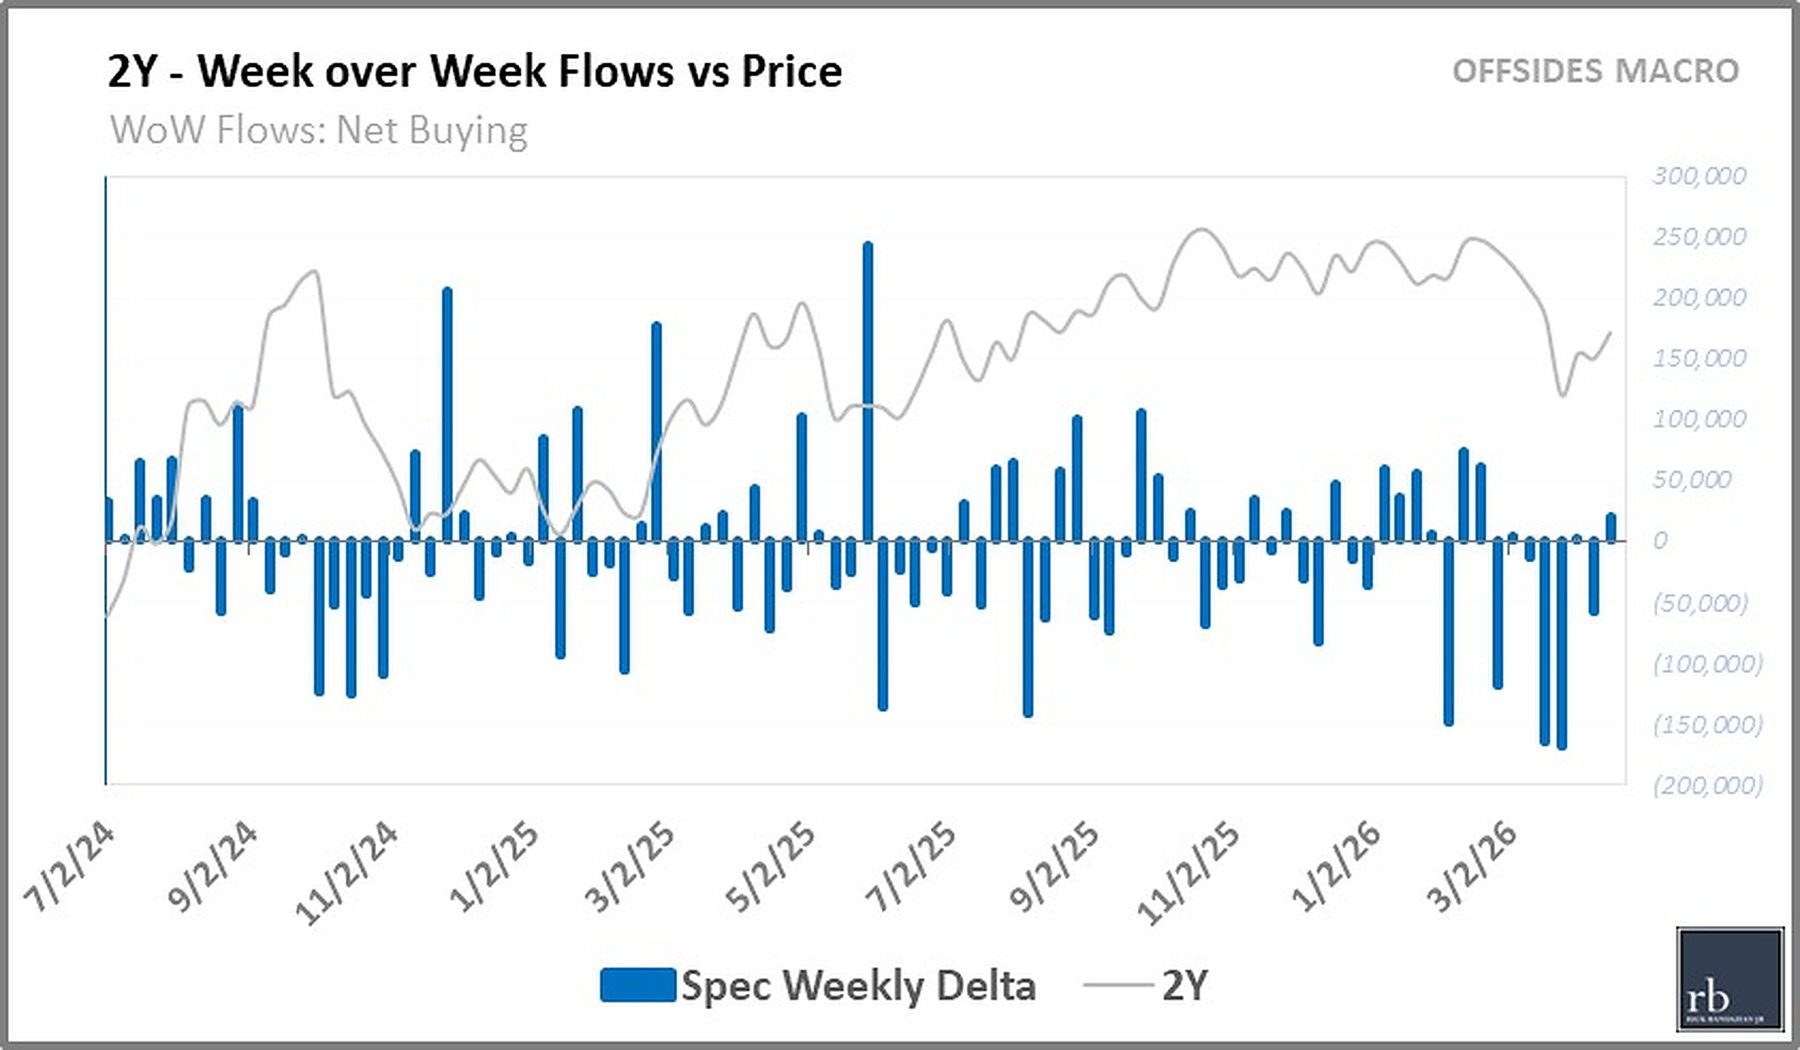
Positioning at the front-end of the curve remains largely unchanged (2s in Lower Extreme, 5s in Upper Extreme). The long-end of the curve continues to show a long opportunity bias. The Long Bond (TLT) is now in Lower Extreme territory and hasn’t been this net-shorted since late ’24 (basis-trade: “Hedge funds’ share of the $31 trillion U.S. Treasury market recently climbed to a record 8%” – Apollo)
| Instrument | Positioning %ile | Wk over Wk | Positioning Regime |
|---|---|---|---|
| 2Y | 0%ile | ▶︎ | Lower Extreme |
| 5Y | 96%ile | ▼ | Upper Extreme |
Positioning at the front-end of the curve remains largely unchanged (2s in Lower Extreme, 5s in Upper Extreme). The long-end of the curve continues to show a long opportunity bias. The Long Bond (TLT) is now in Lower Extreme territory and hasn’t been this net-shorted since late ’24 (basis-trade: “Hedge funds’ share of the $31 trillion U.S. Treasury market recently climbed to a record 8%” – Apollo)
| Instrument | Positioning %ile | Wk over Wk | Positioning Regime |
|---|---|---|---|
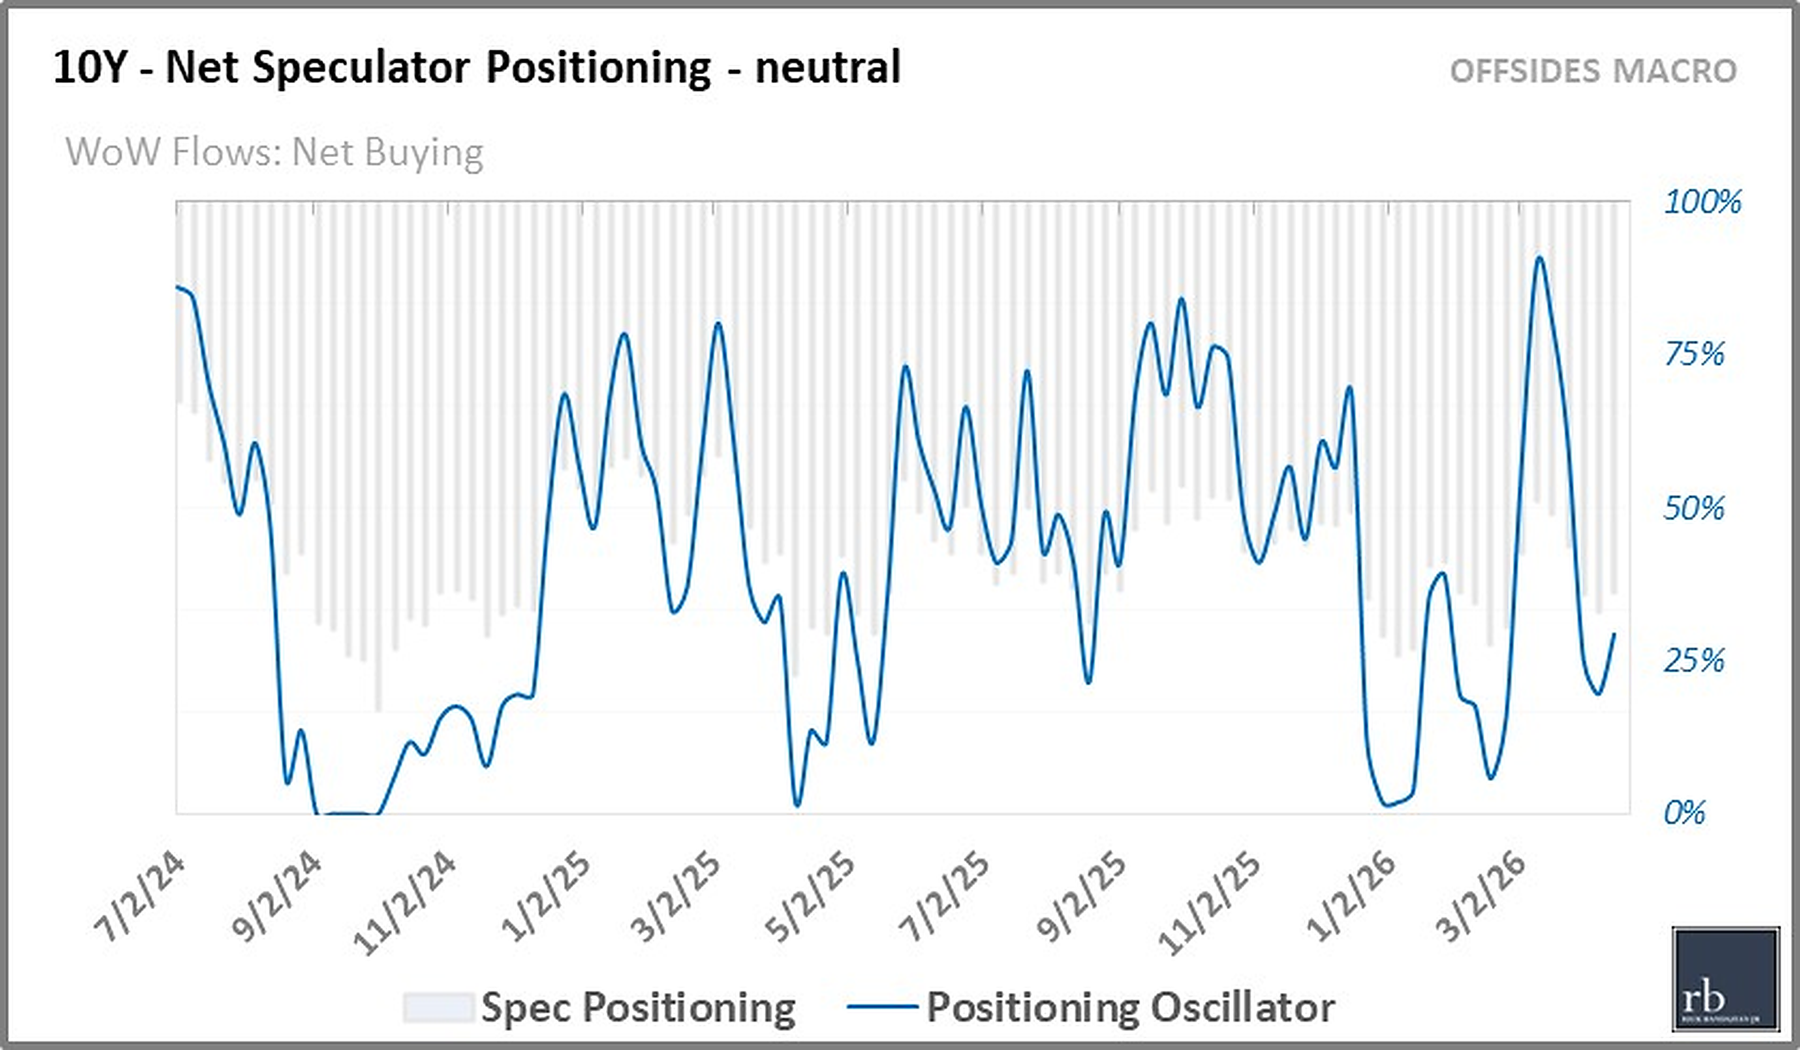
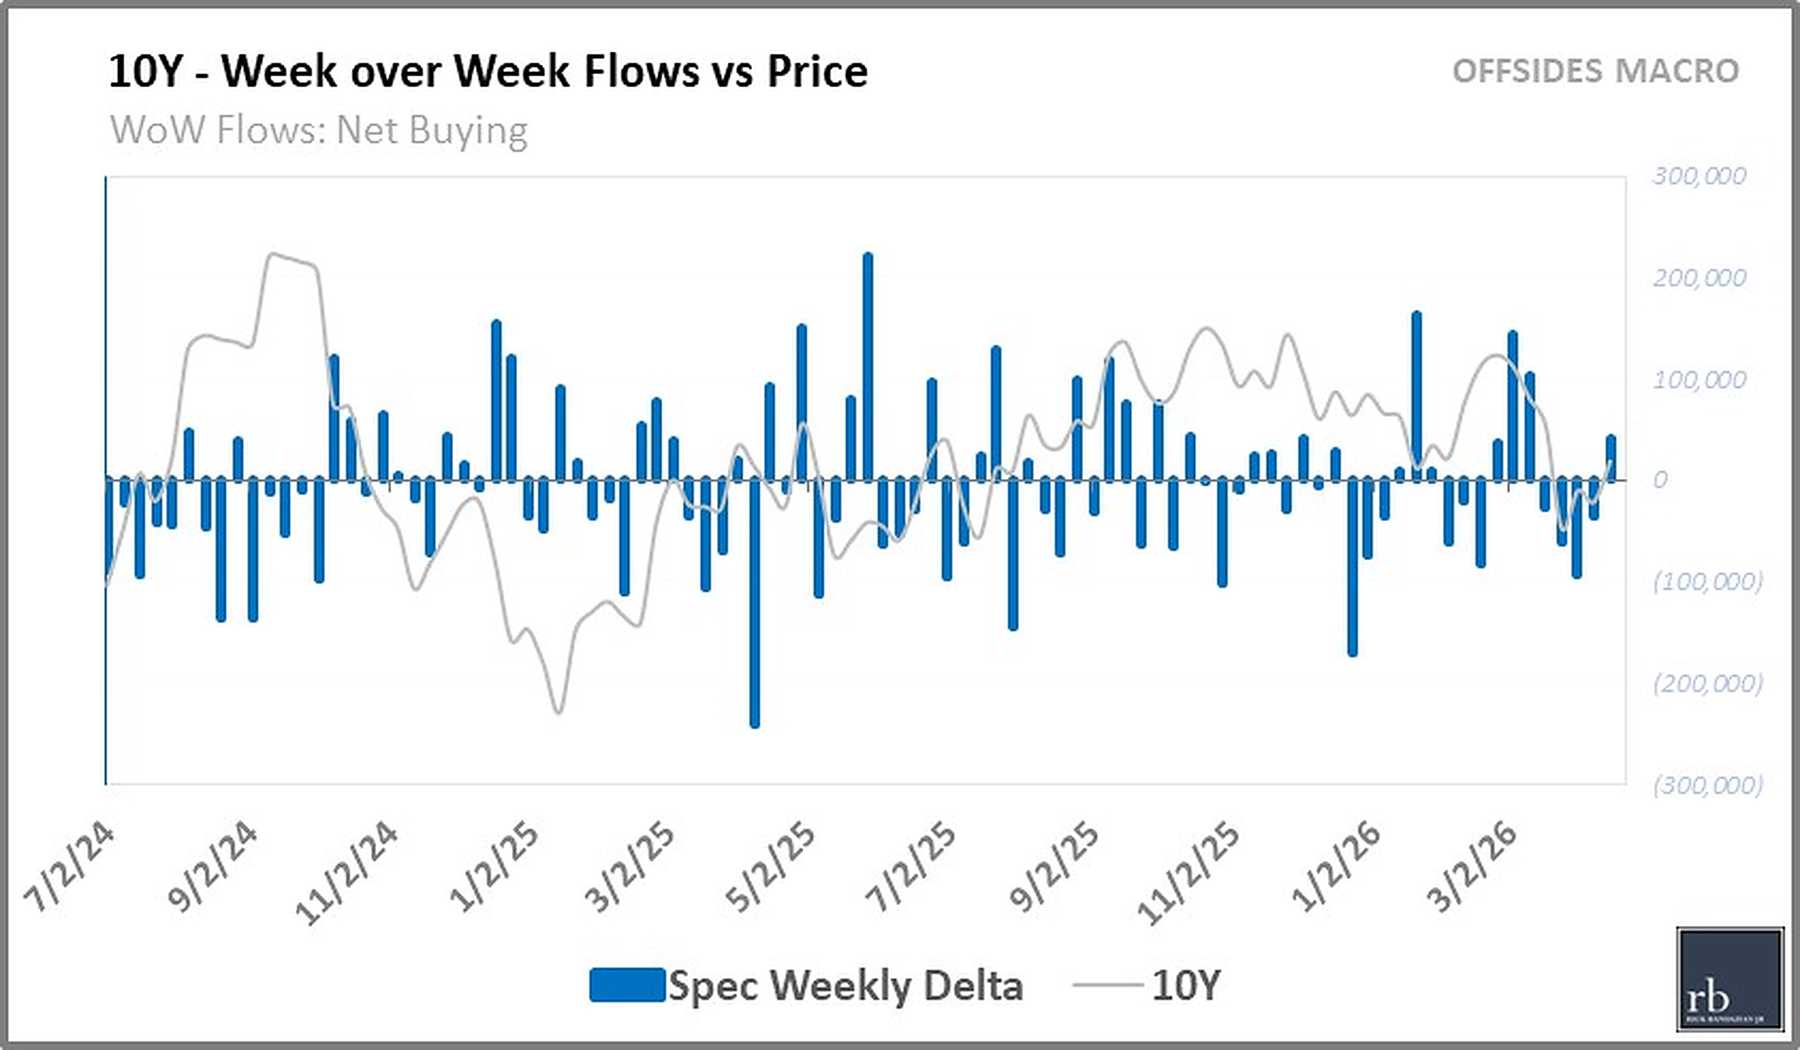
| 10Y | 29%ile | ▲ | Neutral |
| Long Bond | 0%ile | ▼ | Lower Extreme |
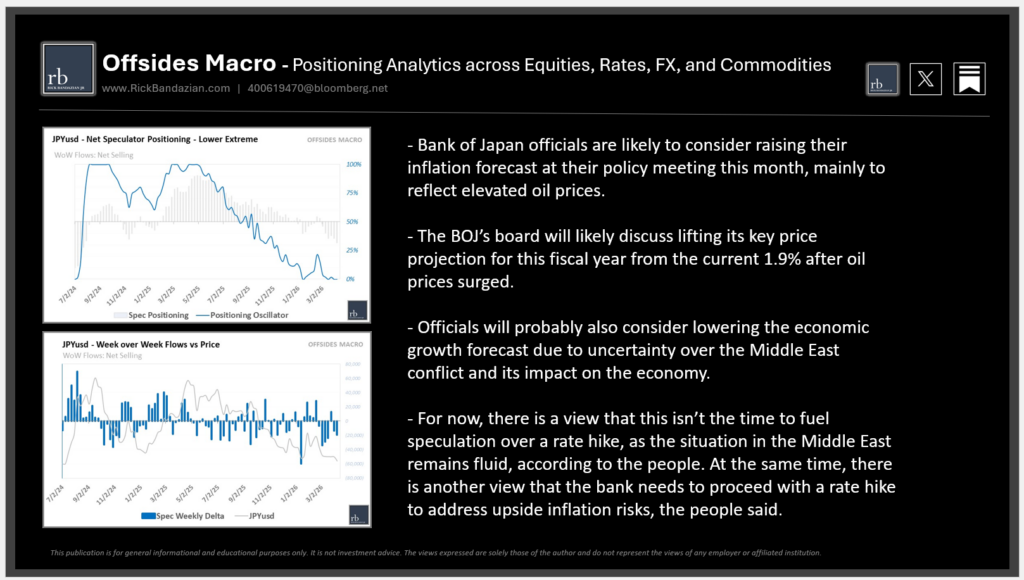
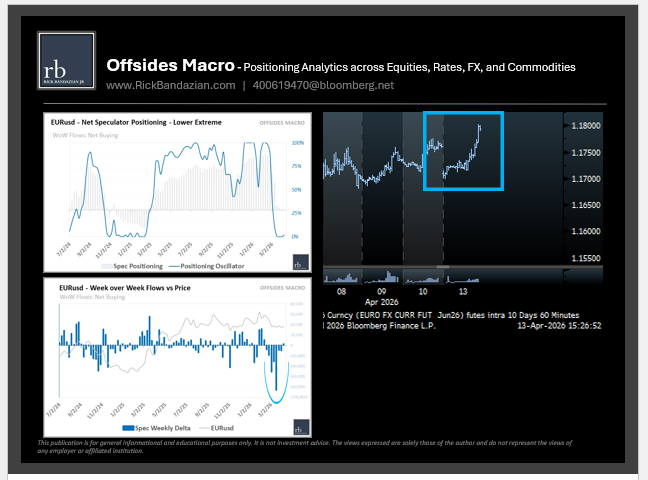
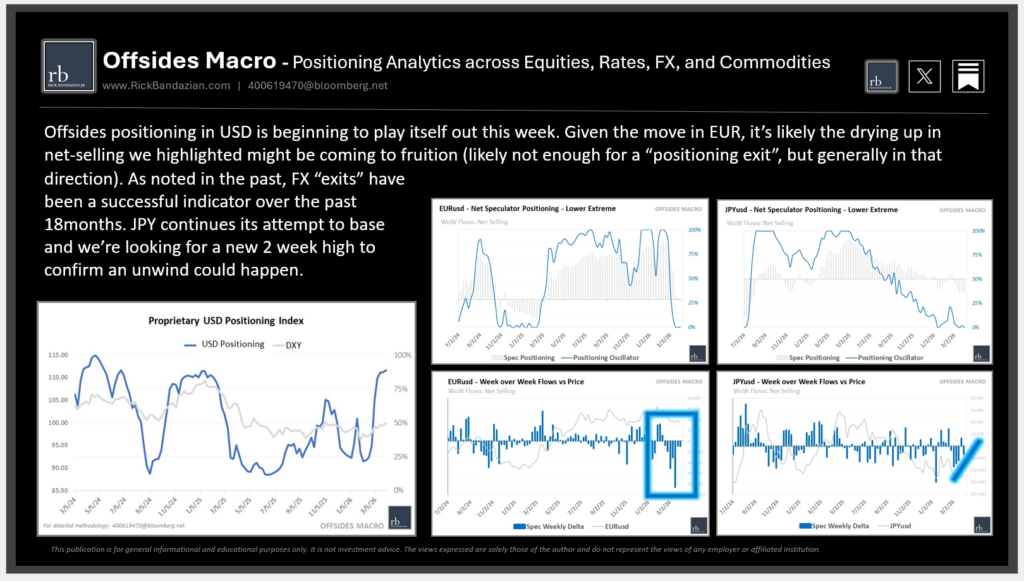
USD positioning remains well into the upper quartile and EUR positioning flows continue to trend having its largest net-buying in 12mo. AUD flows are signaling sings of cracks just as the recent high correlation to risk-on weakened on Friday. JPY positioning remains near 18mo lows in Lower Extreme territory.
Why Offsides Macro “Proprietary USD Positioning Index” Is More Informative Than Looking Only at DXY Futures: Looking only at DXY futures positioning is flawed because the DXY contract represents only a small fraction of total USD exposure, while most positioning occurs in the much larger individual currency futures that make up the DXY index. OM’s USD Positioning Index aggregates speculative positioning across those underlying contracts and weights them according to the actual DXY index composition, creating a synthetic USD exposure indicator that better reflects how the market is truly positioned.
| Instrument | Positioning %ile | Wk over Wk | Positioning Regime |
|---|---|---|---|
| USD | 86%ile | ▼ | Upper Quartile |
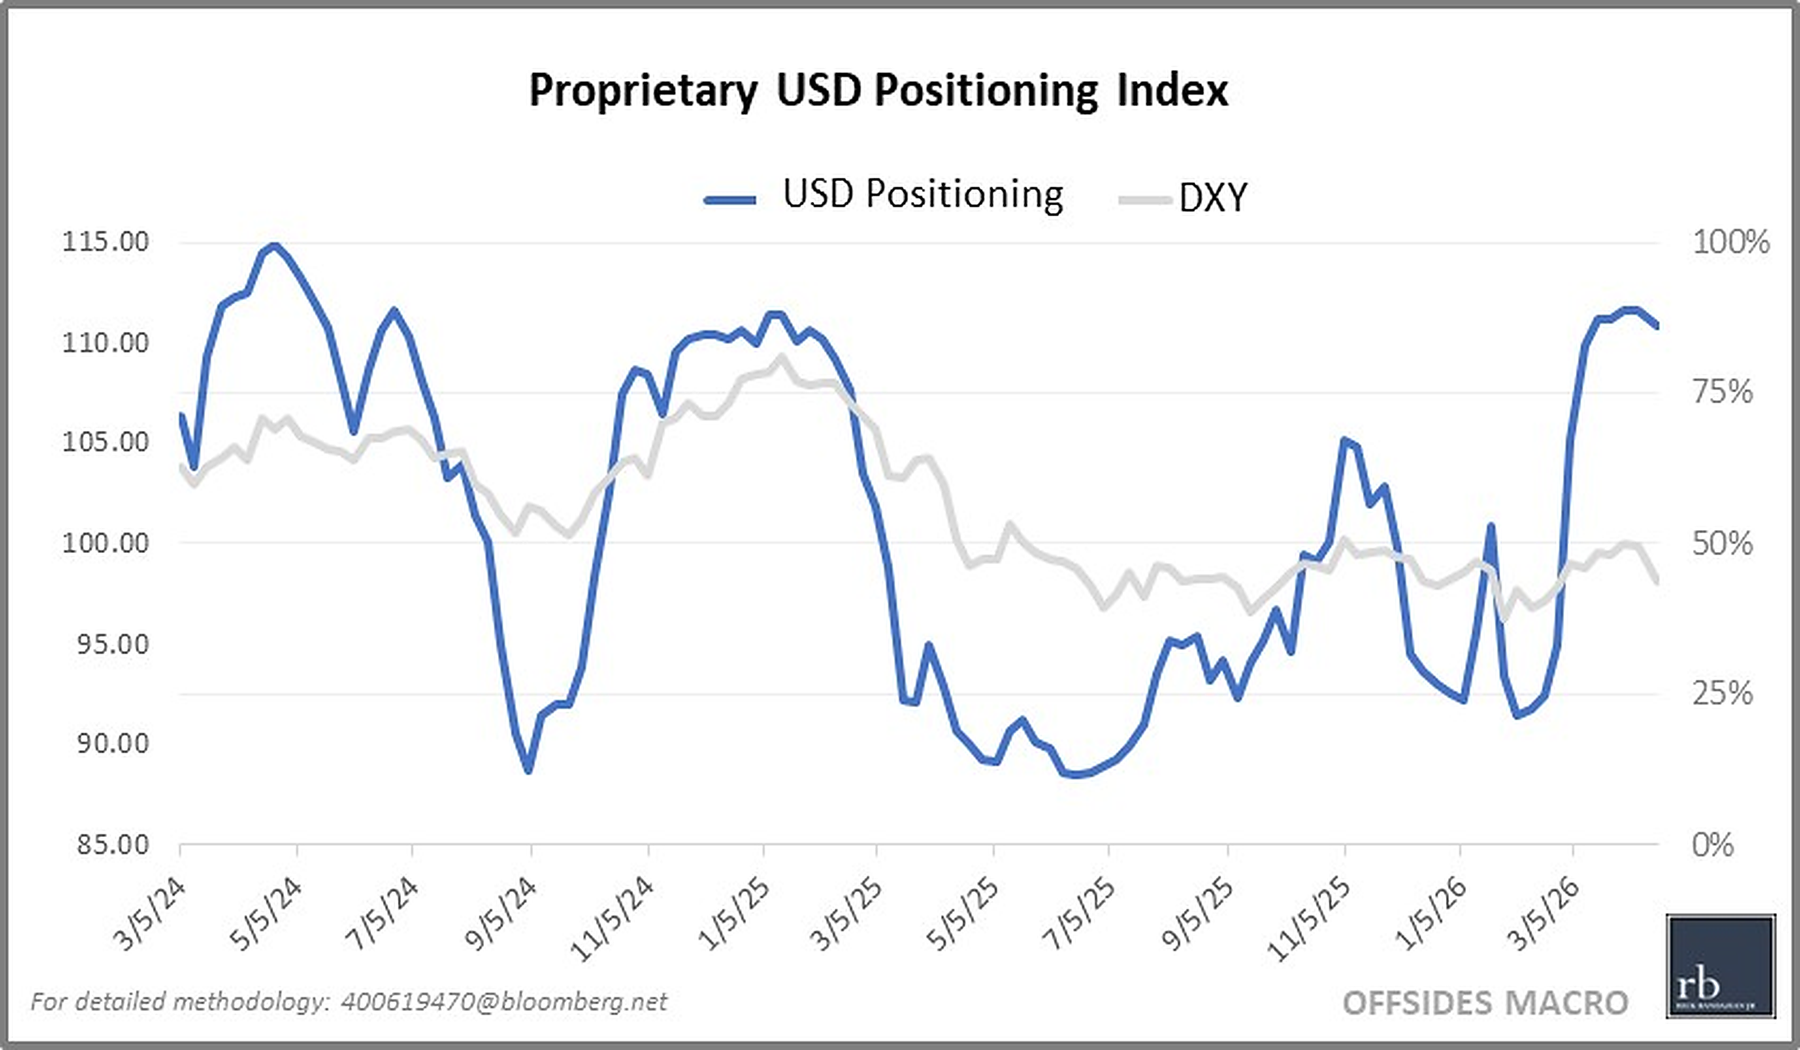
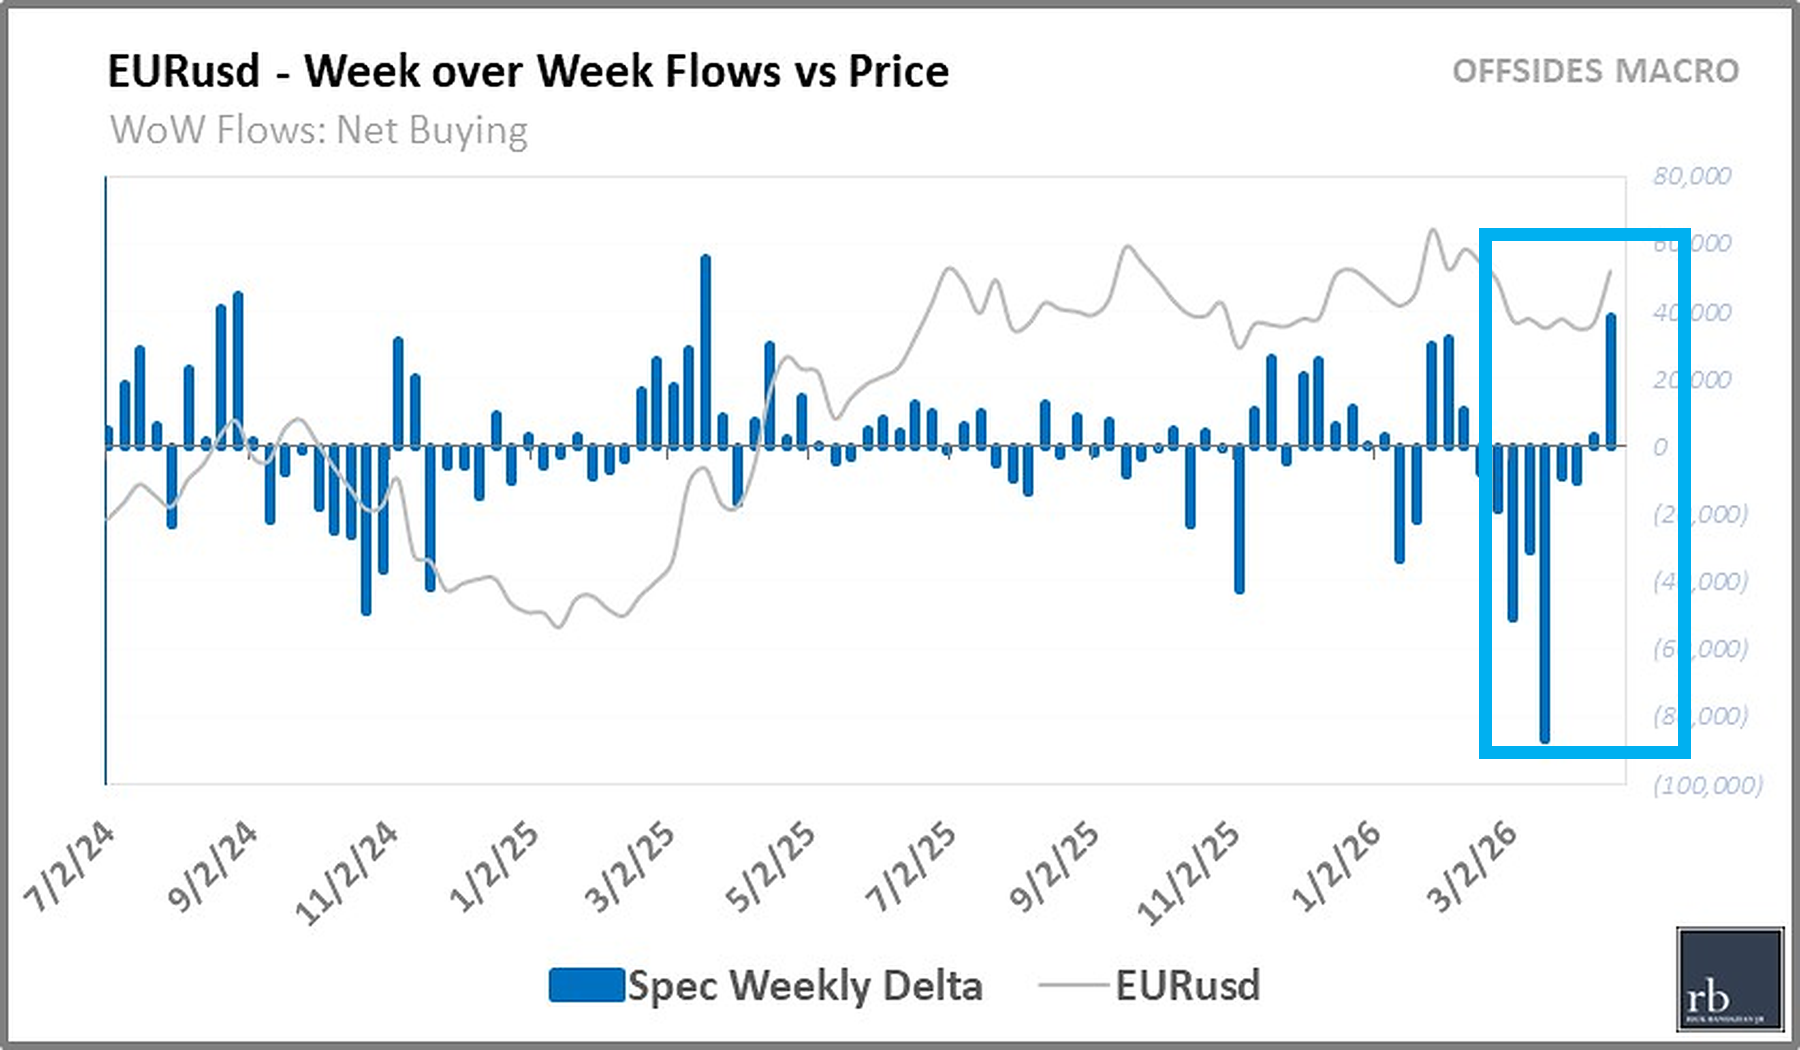
USD positioning remains well into the upper quartile and EUR positioning flows continue to trend having its largest net-buying in 12mo. AUD flows are signaling sings of cracks just as the recent high correlation to risk-on weakened on Friday. JPY positioning remains near 18mo lows in Lower Extreme territory.
| Instrument | Positioning %ile | Wk over Wk | Positioning Regime |
|---|---|---|---|
| EURusd | 8%ile | ▲ | Lower Extreme |
| GBPusd | 24%ile | ▲ | Lower Quartile |
| CHFusd | 20%ile | ▼ | Lower Quartile |
| AUDusd | 92%ile | ▼ | Upper Extreme |
| CADusd | 51%ile | ▼ | Neutral |
| JPYusd | 2%ile | ▲ | Lower Extreme |
| NZDusd | 24%ile | ▼ | Lower Quartile |
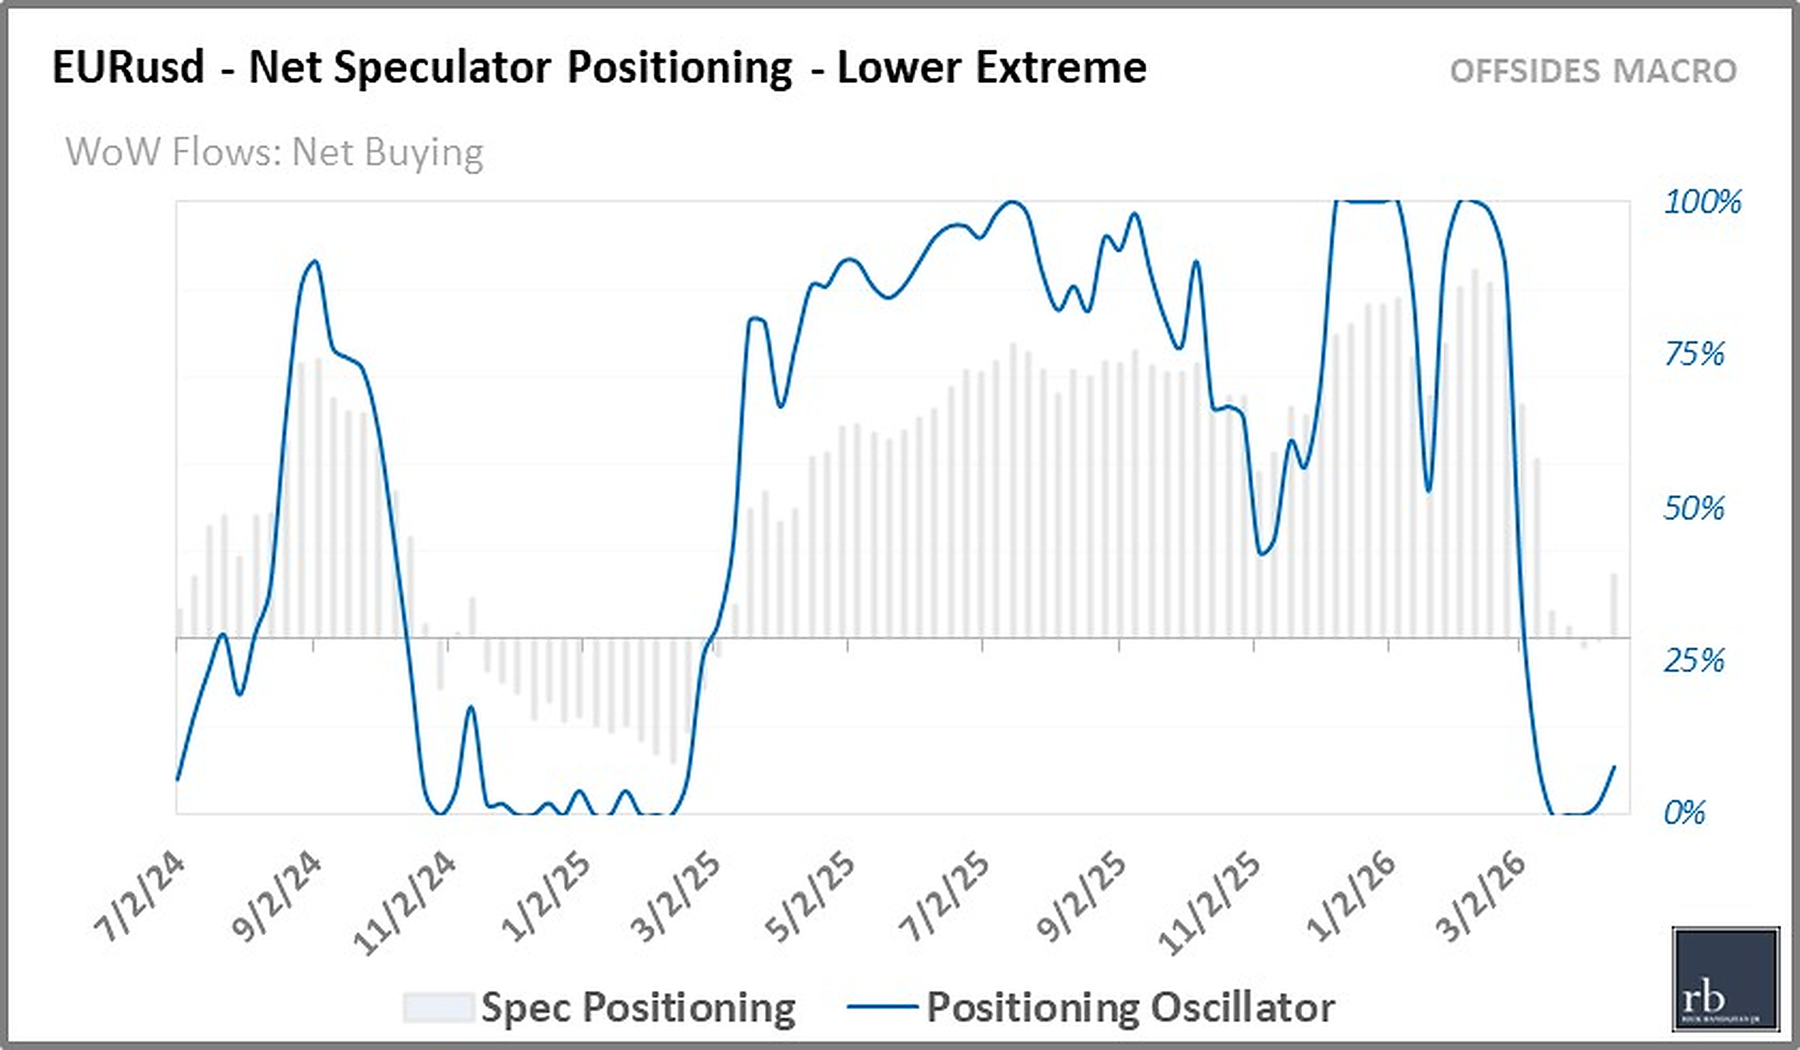

USD positioning remains well into the upper quartile and EUR positioning flows continue to trend having its largest net-buying in 12mo. AUD flows are signaling sings of cracks just as the recent high correlation to risk-on weakened on Friday. JPY positioning remains near 18mo lows in Lower Extreme territory.
| Instrument | Positioning %ile | Wk over Wk | Positioning Regime |
|---|---|---|---|
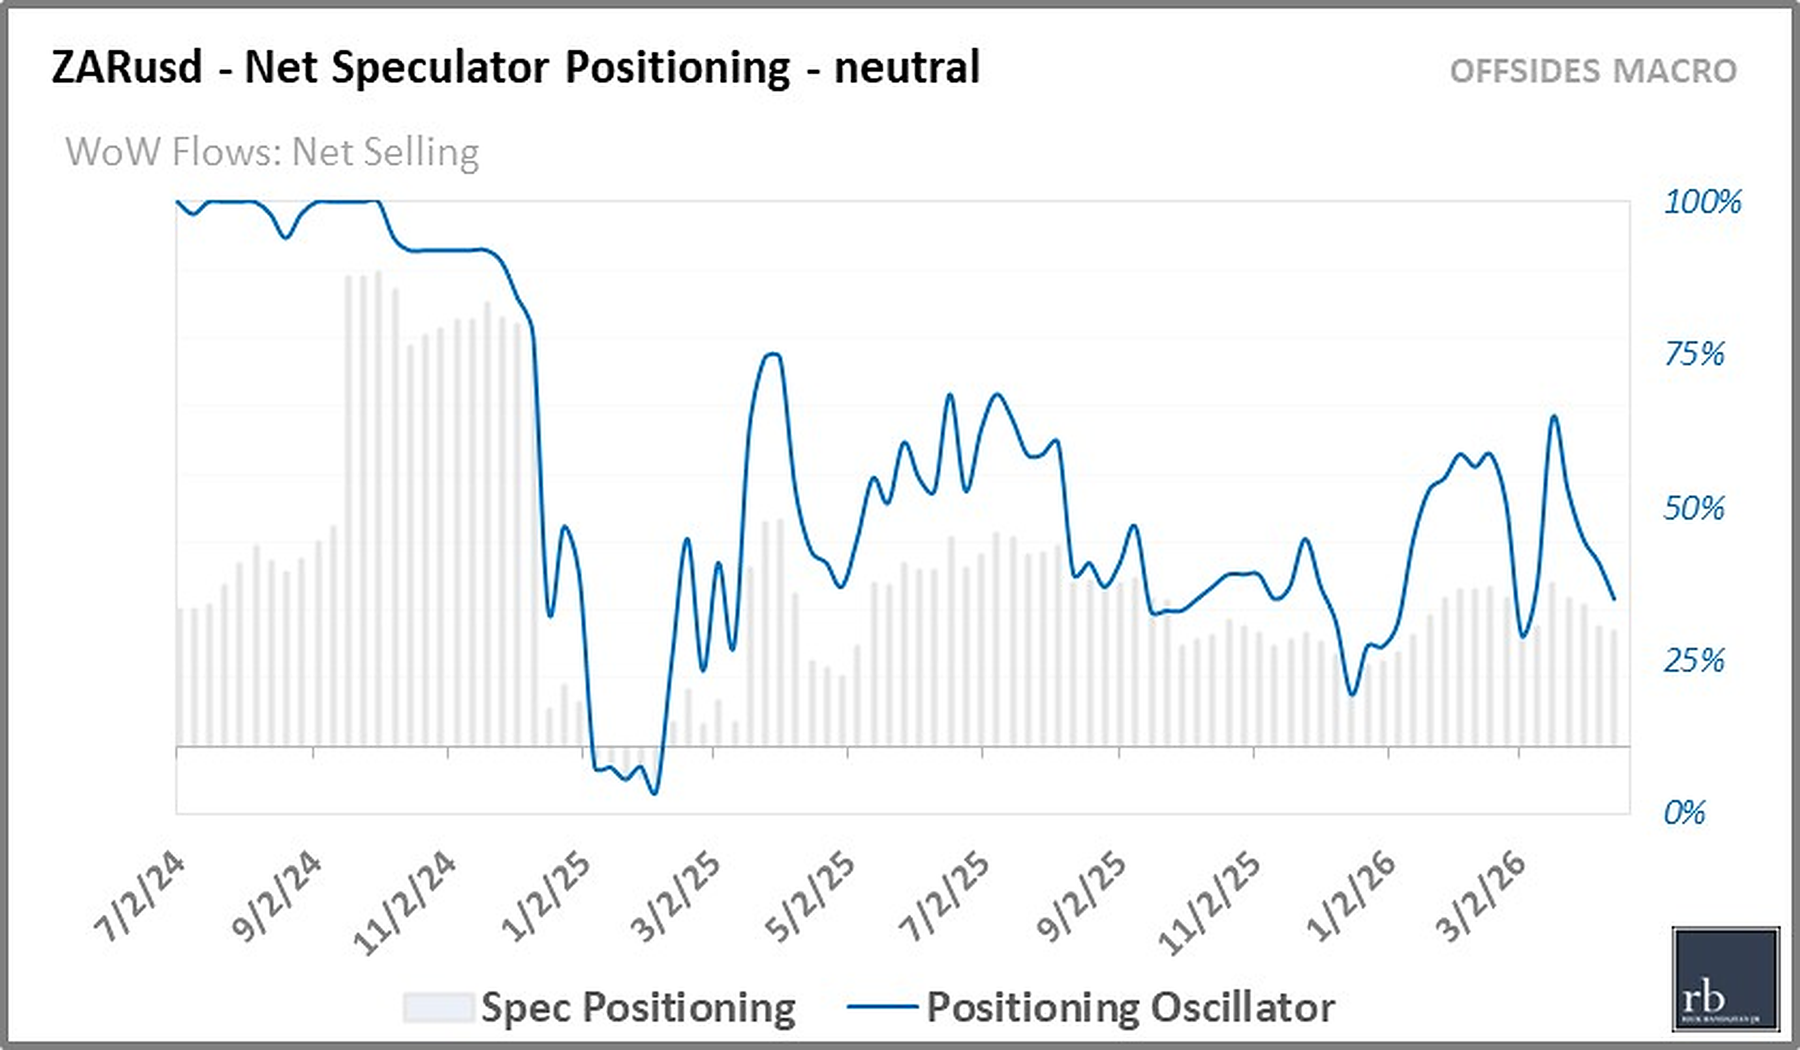
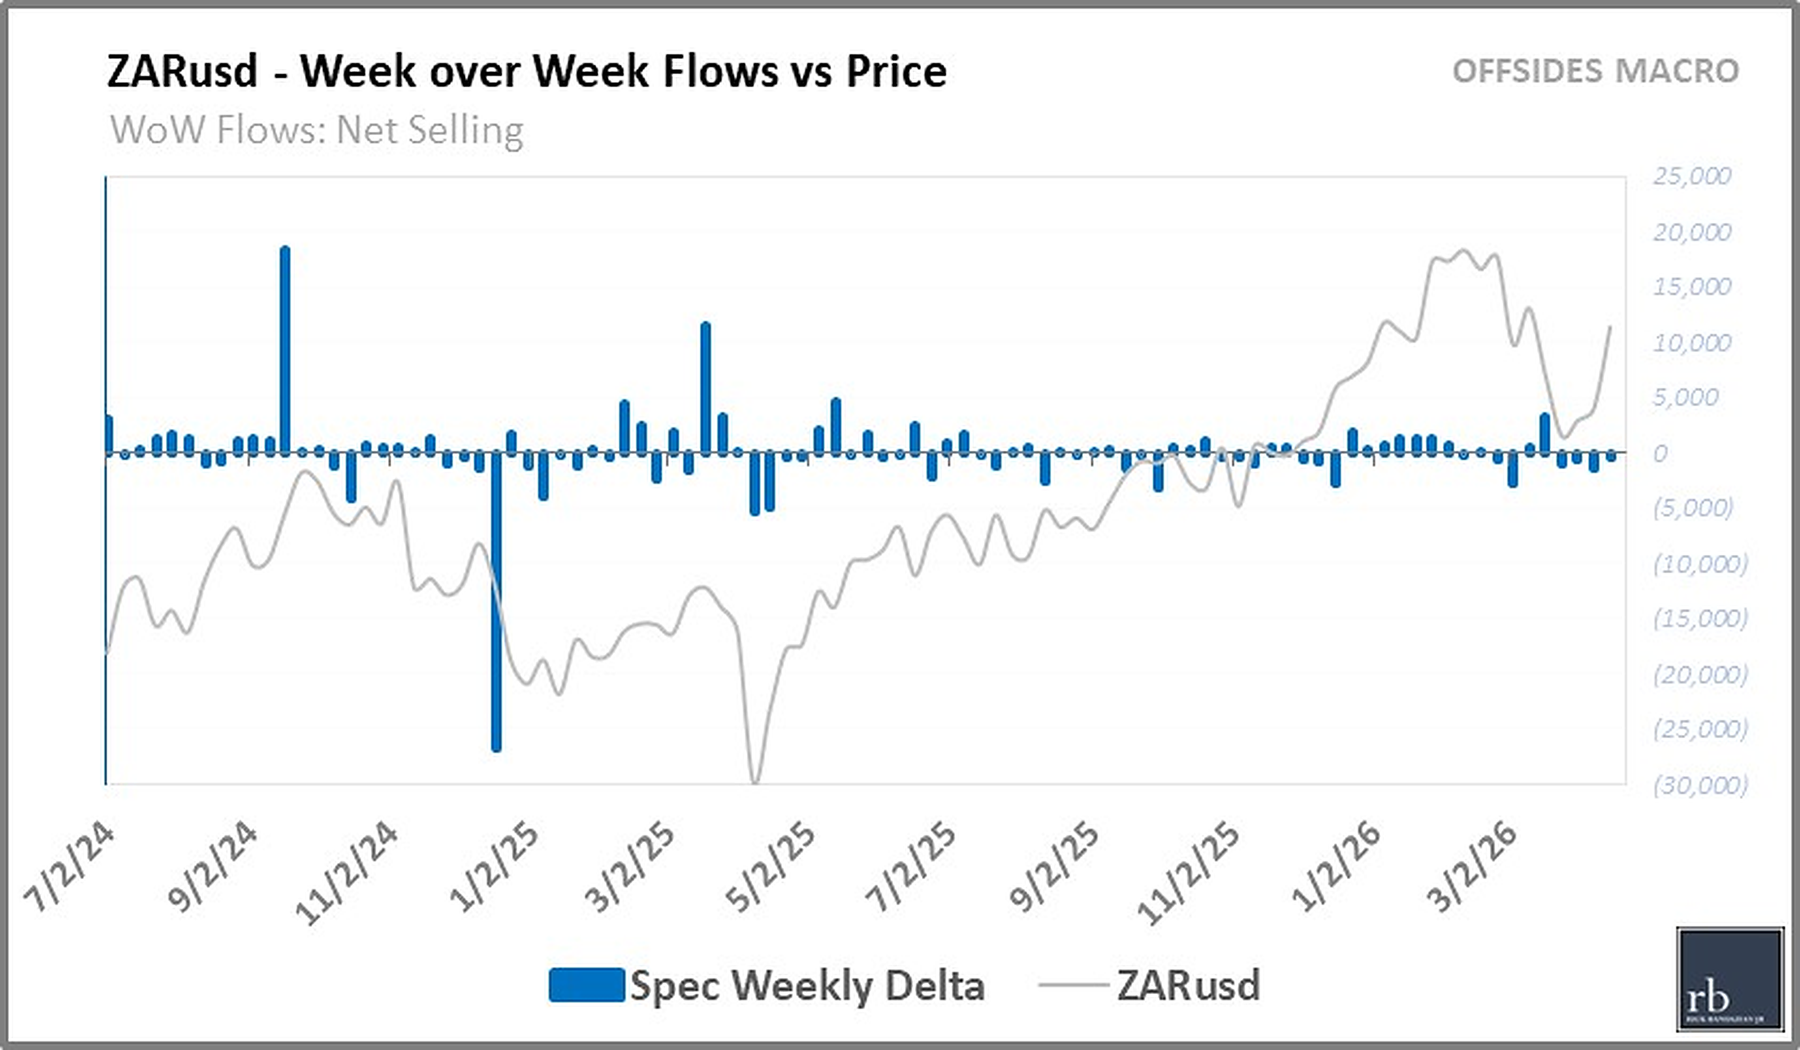
| ZARusd | 35%ile | ▼ | Neutral |
| BRLusd | 39%ile | ▶︎ | Neutral |
| MXNusd | 20%ile | ▶︎ | Lower Quartile |
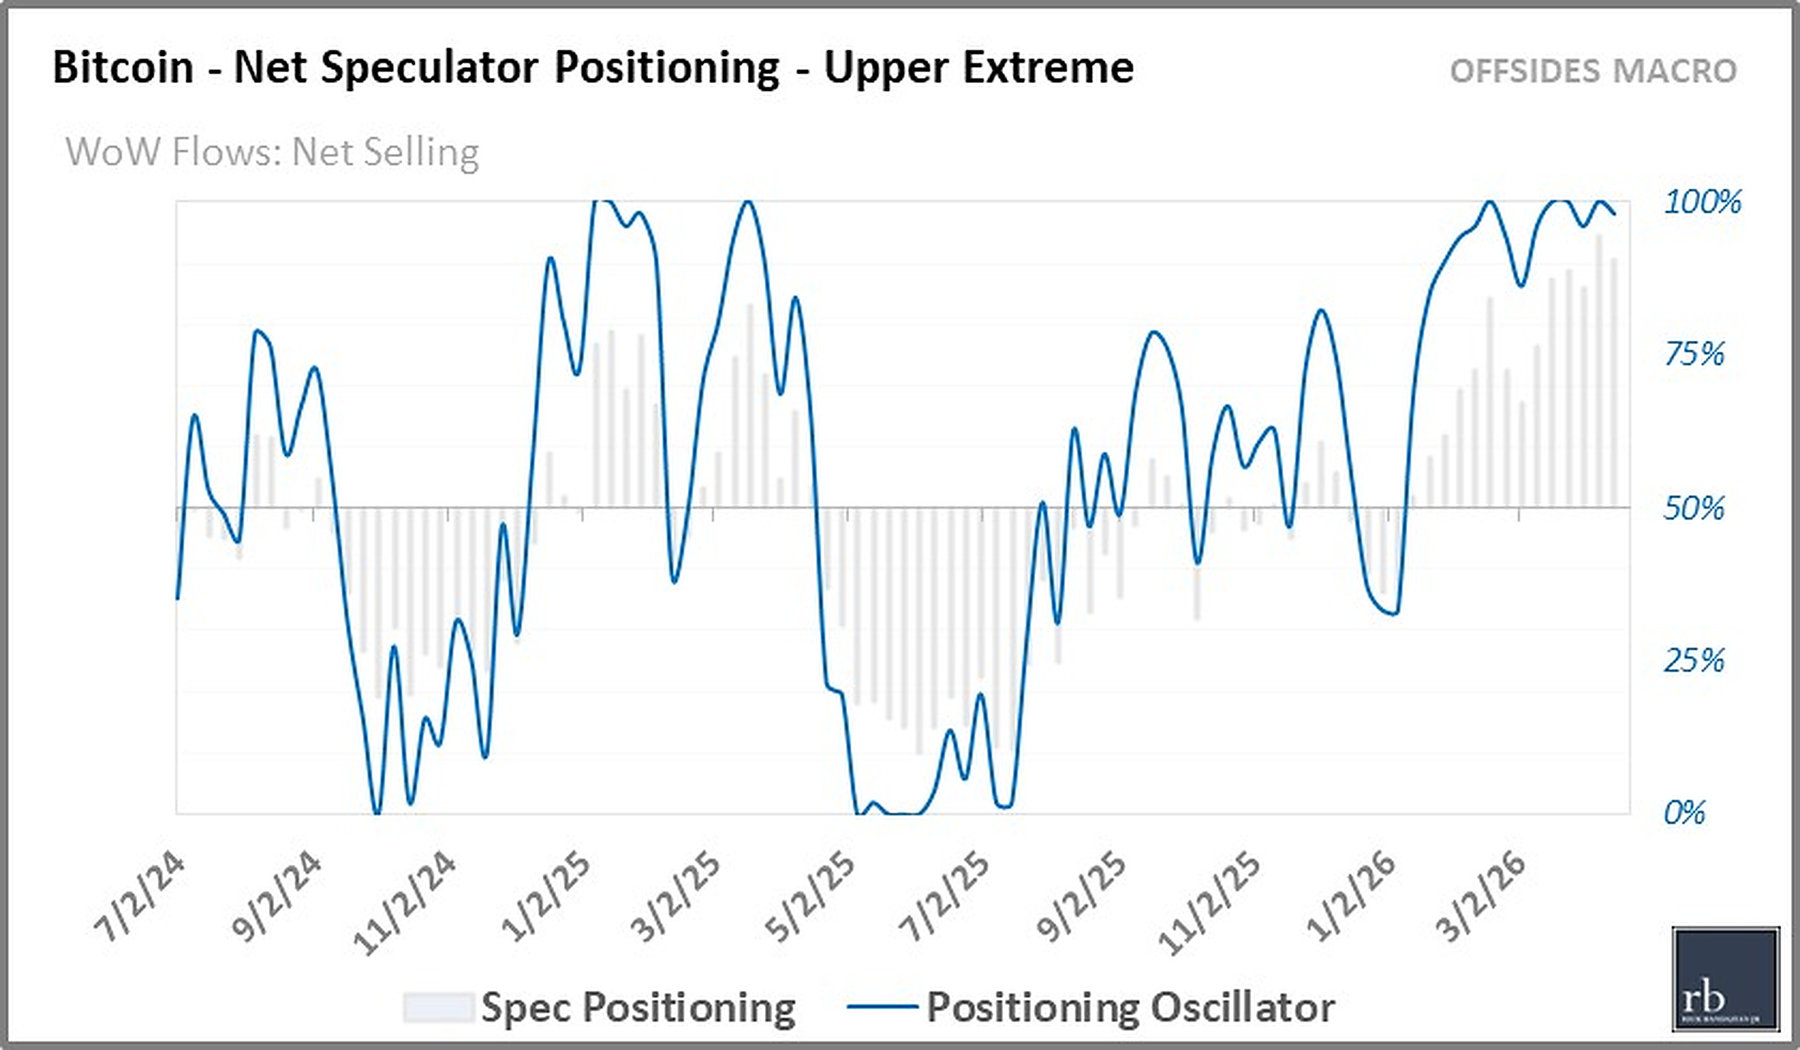
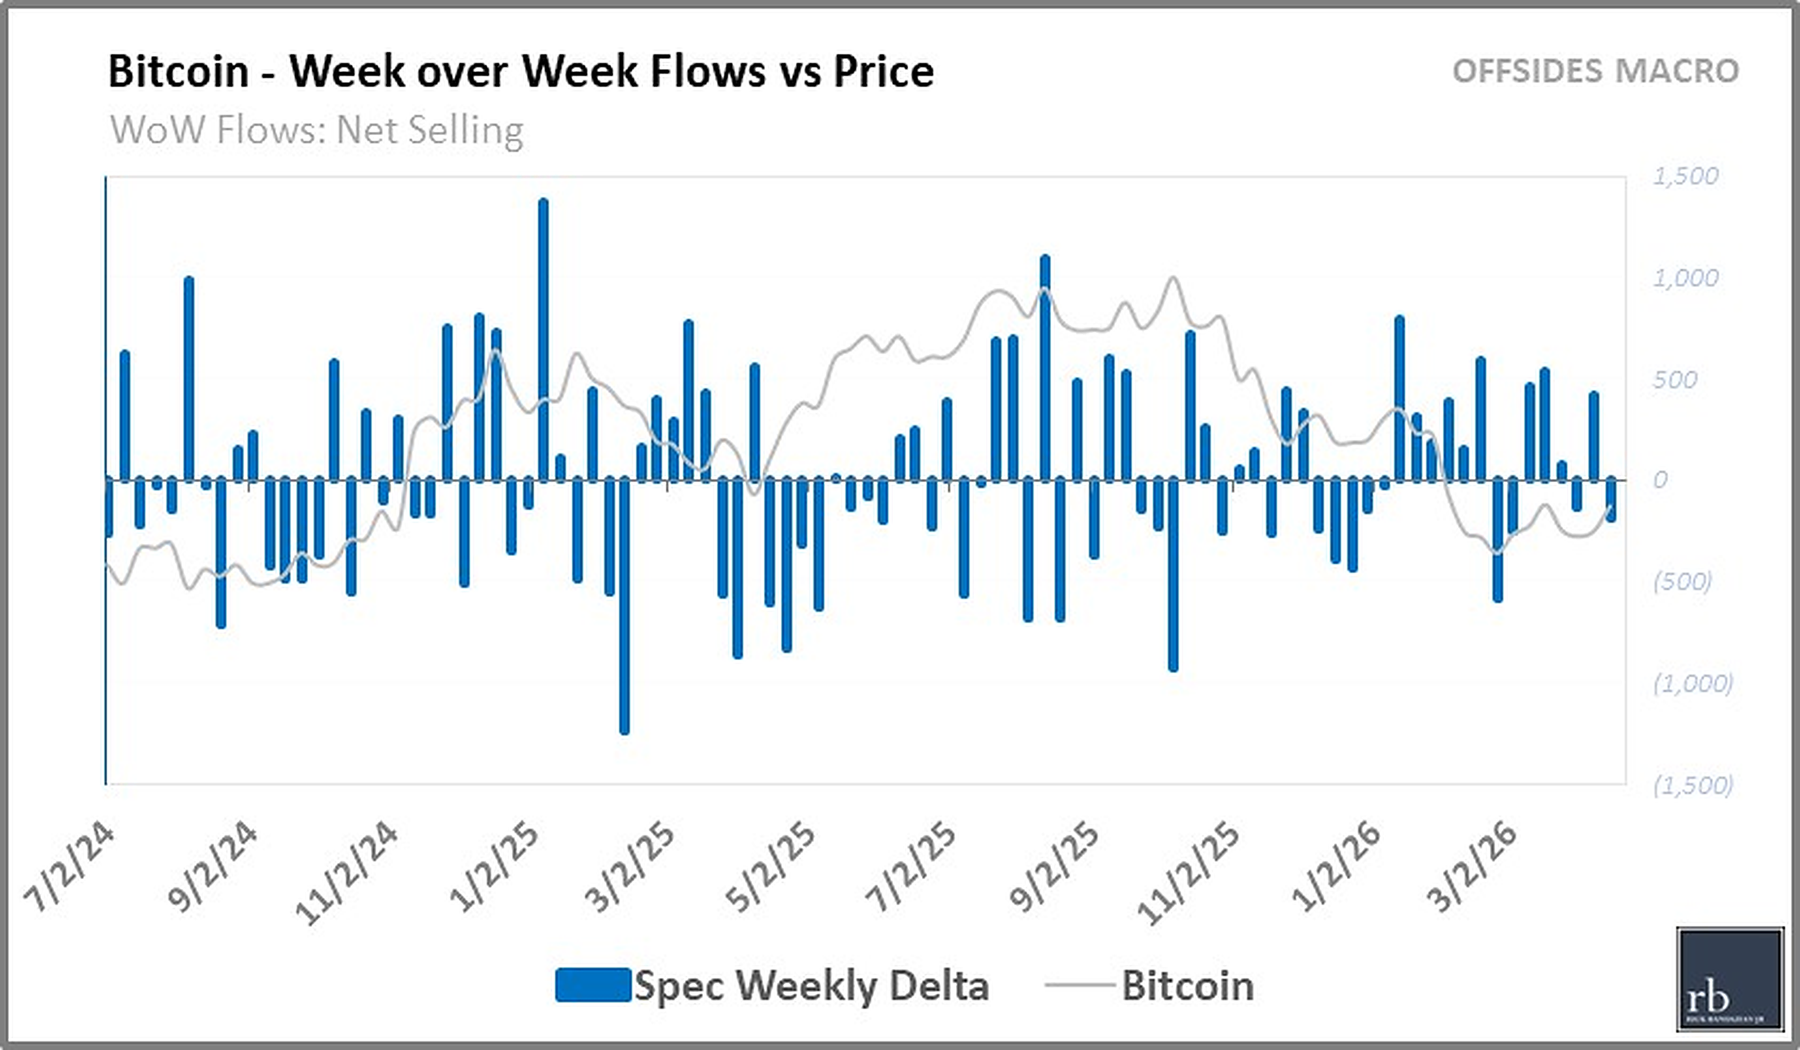
As I wrote in my White Paper — Offsides Positioning as a Factor in Systematic and Discretionary Macro 2026 — markets such as Crypto, FCOJ, Lumber, etc with lower liquidity, structurally distorted positioning, or insufficiently mature datasets are excluded given lower confidence levels. However, here is the Oscillator and Week over Week flows charts.
| Instrument | Positioning %ile | Wk over Wk | Positioning Regime |
|---|---|---|---|
| Bitcoin | 98%ile | ▼ | Upper Extreme |
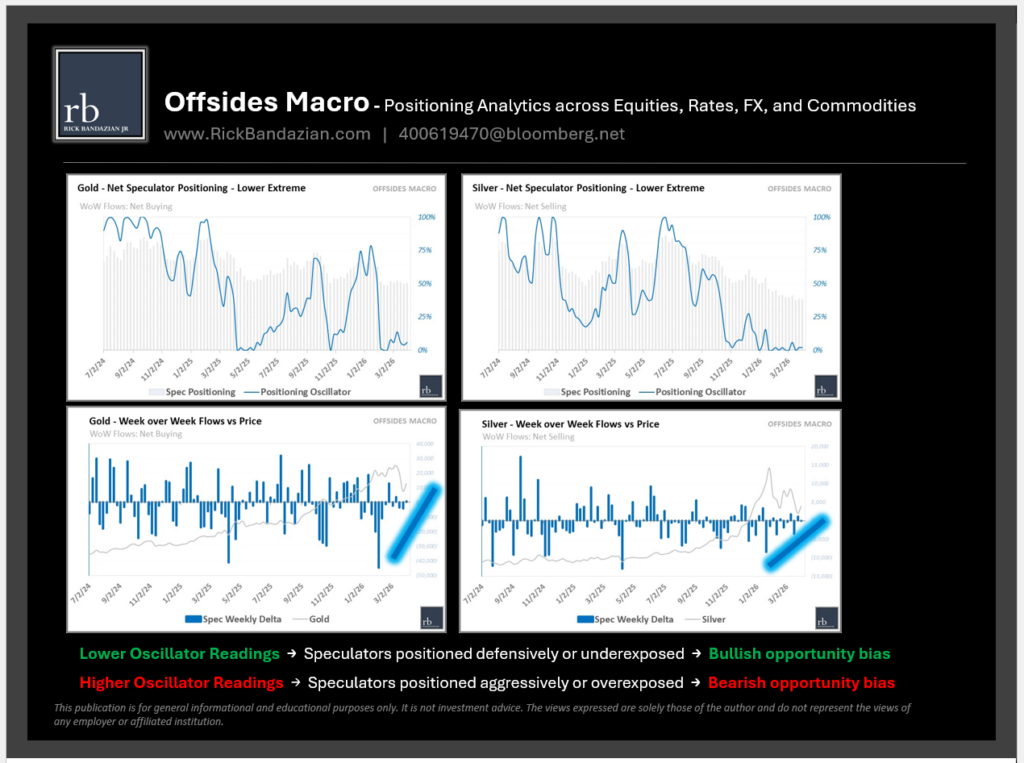
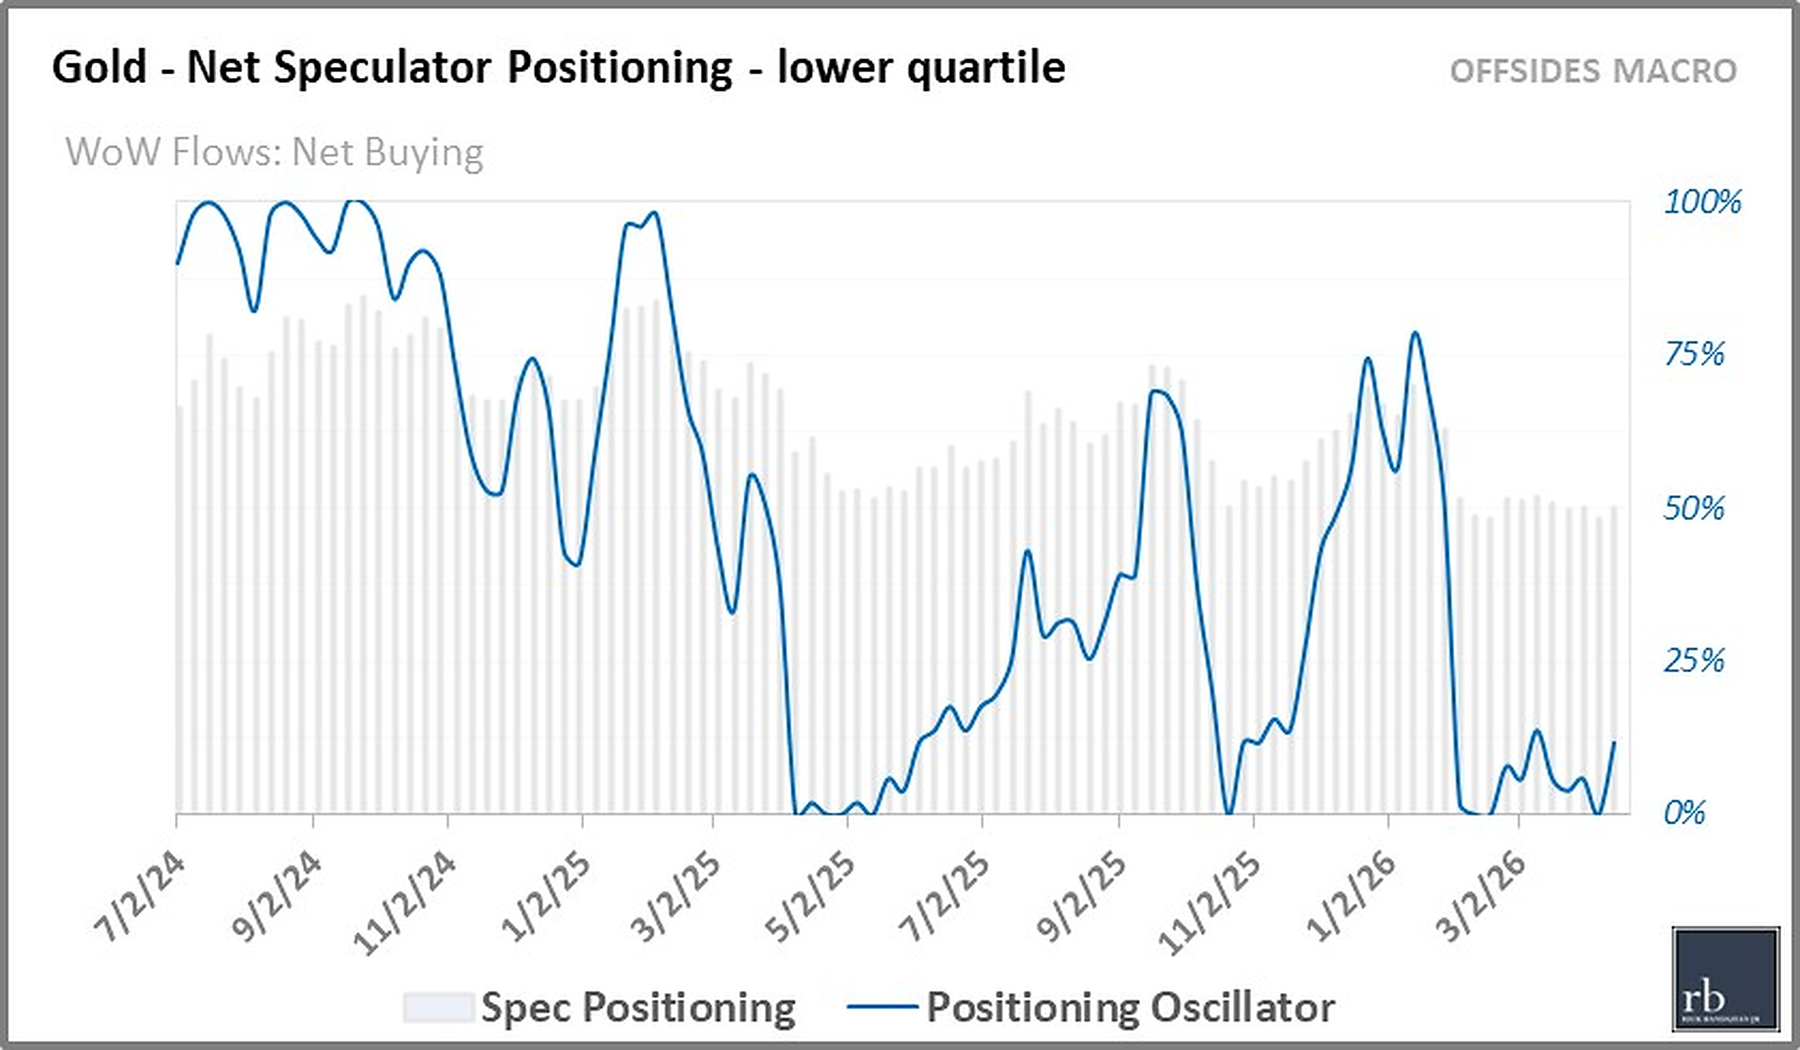
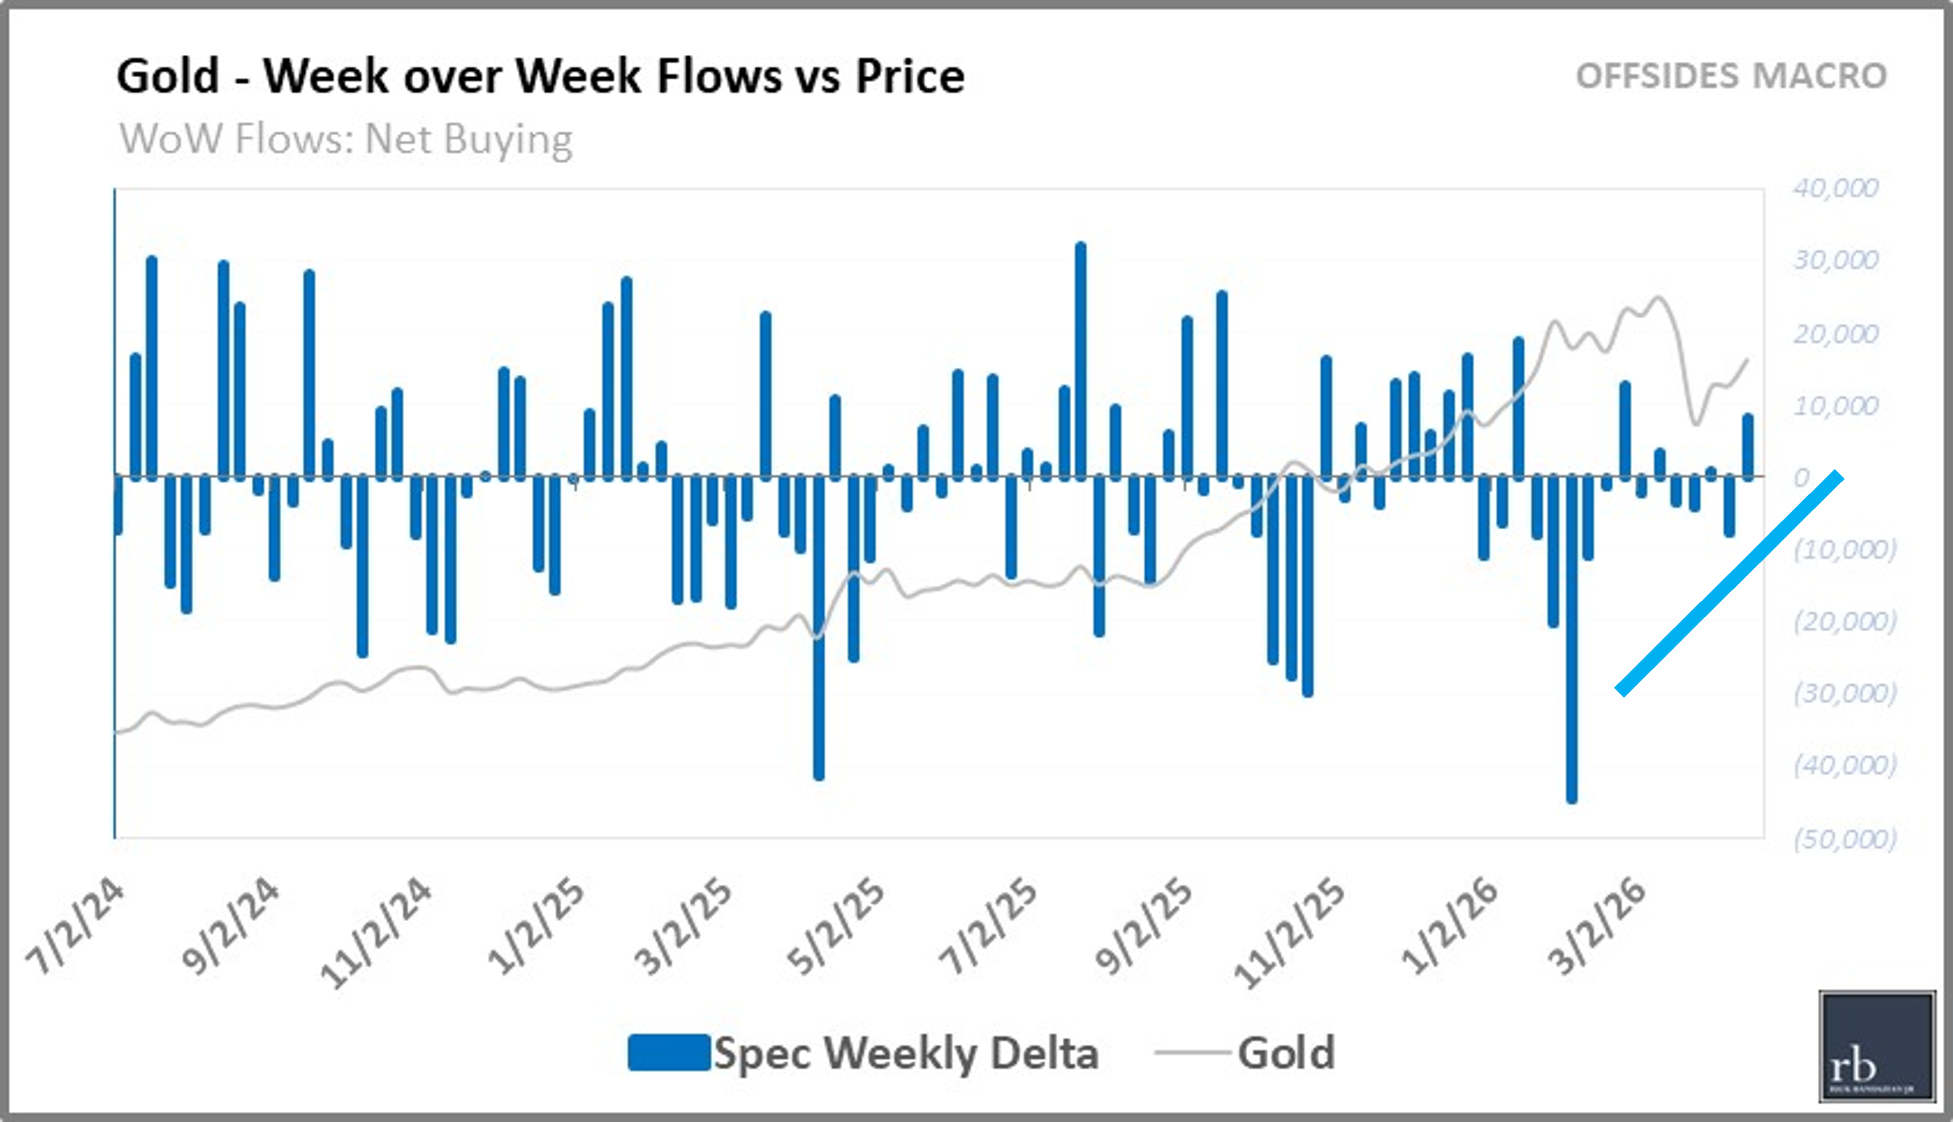
Gold and Silver remain in a Risk-On opportunity bias. Both climbed out of Lower Extreme positioning and barely into the lower quartile as positioning flows show continued momentum. We’d prefer the risk-on correlation to lessen AND see the metals perform well to give us more confirmation for this bias, but the pullback in Equities positioning could continue to provide a tailwind to both as correlations remain high. Copper continues its drift back up towards the upper quartile as Platinum and Palladium remain squarely within neutral range.
| Instrument | Positioning %ile | Wk over Wk | Positioning Regime |
|---|---|---|---|
| Gold | 12%ile | ▲ | Lower Quartile |
| Silver | 12%ile | ▲ | Lower Quartile |
| Copper | 73%ile | ▲ | Neutral |
| Platinum | 55%ile | ▲ | Neutral |
| Palladium | 43%ile | ▶︎ | Neutral |
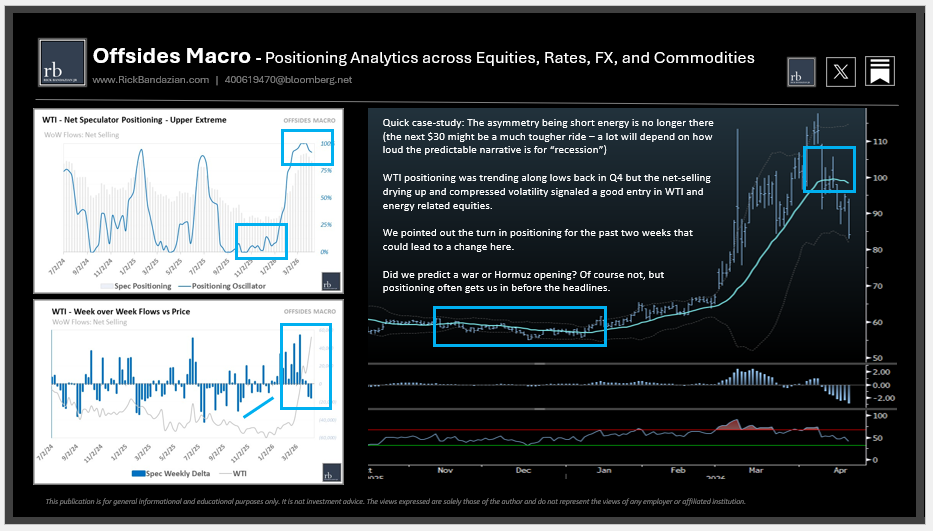
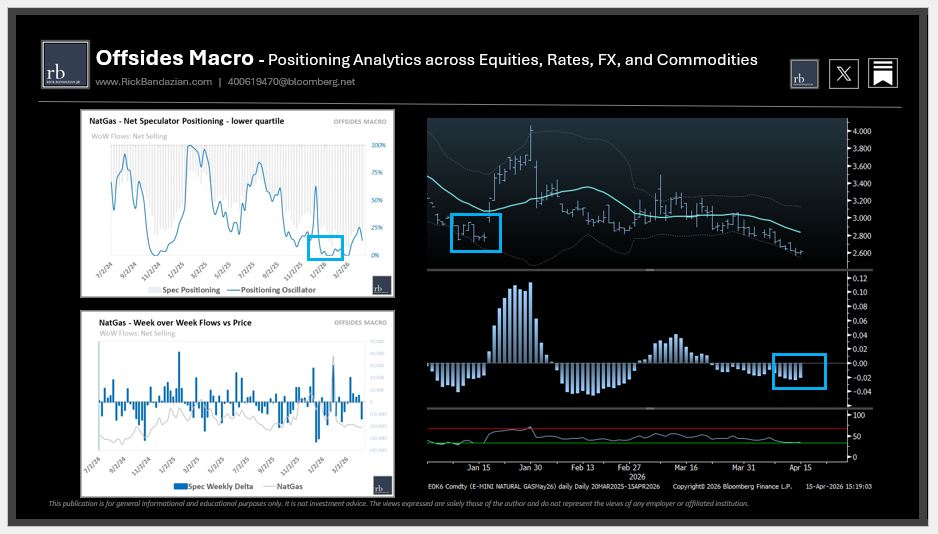
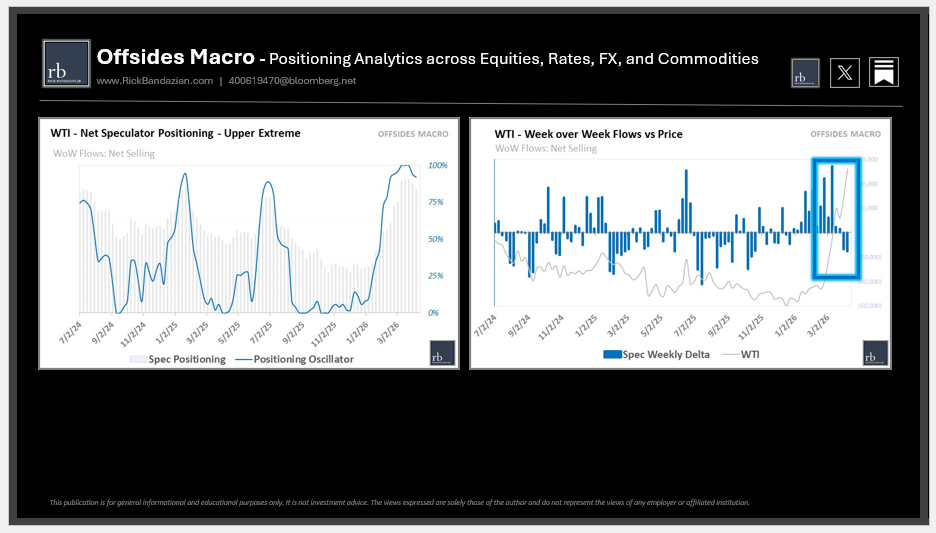
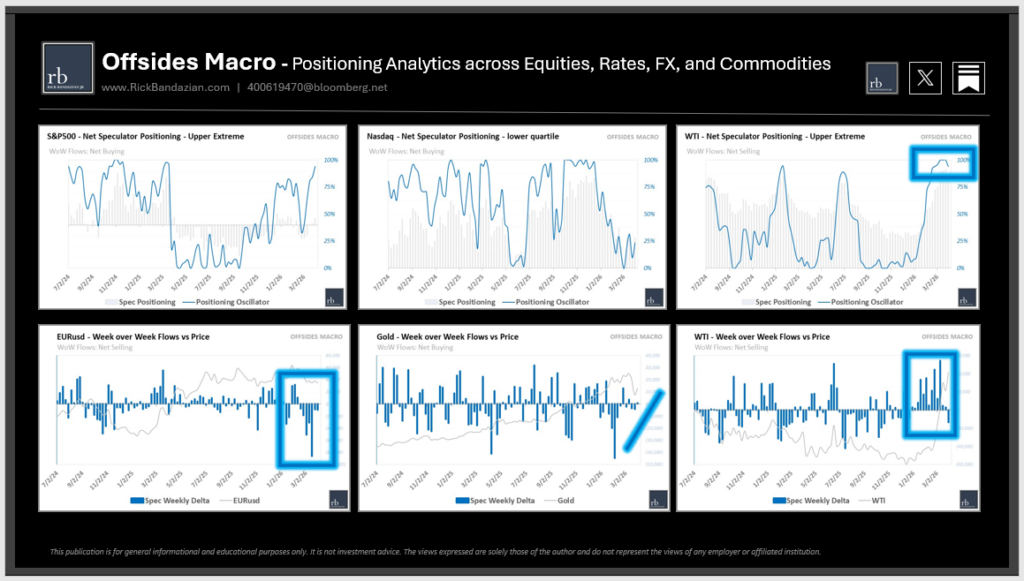
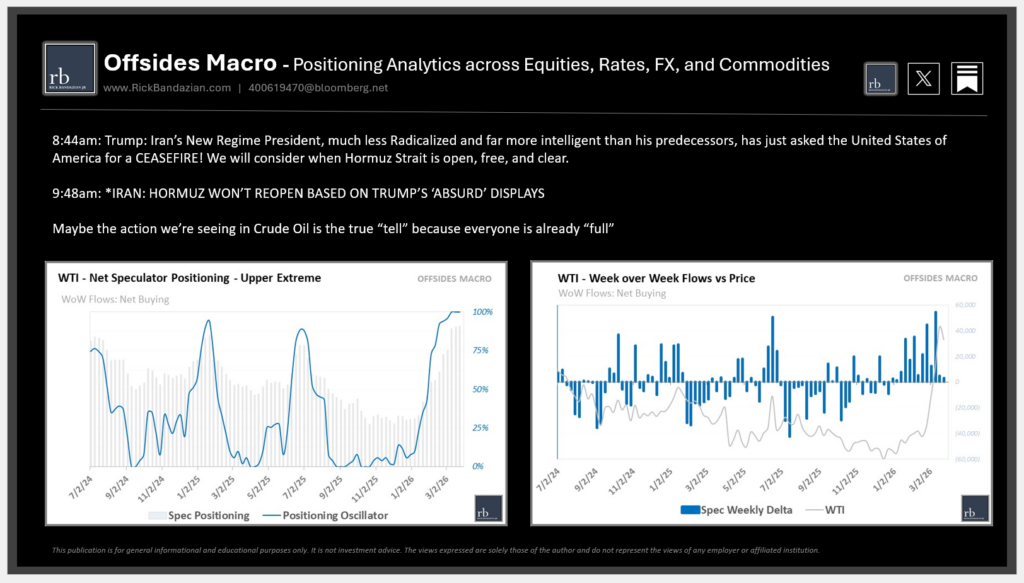
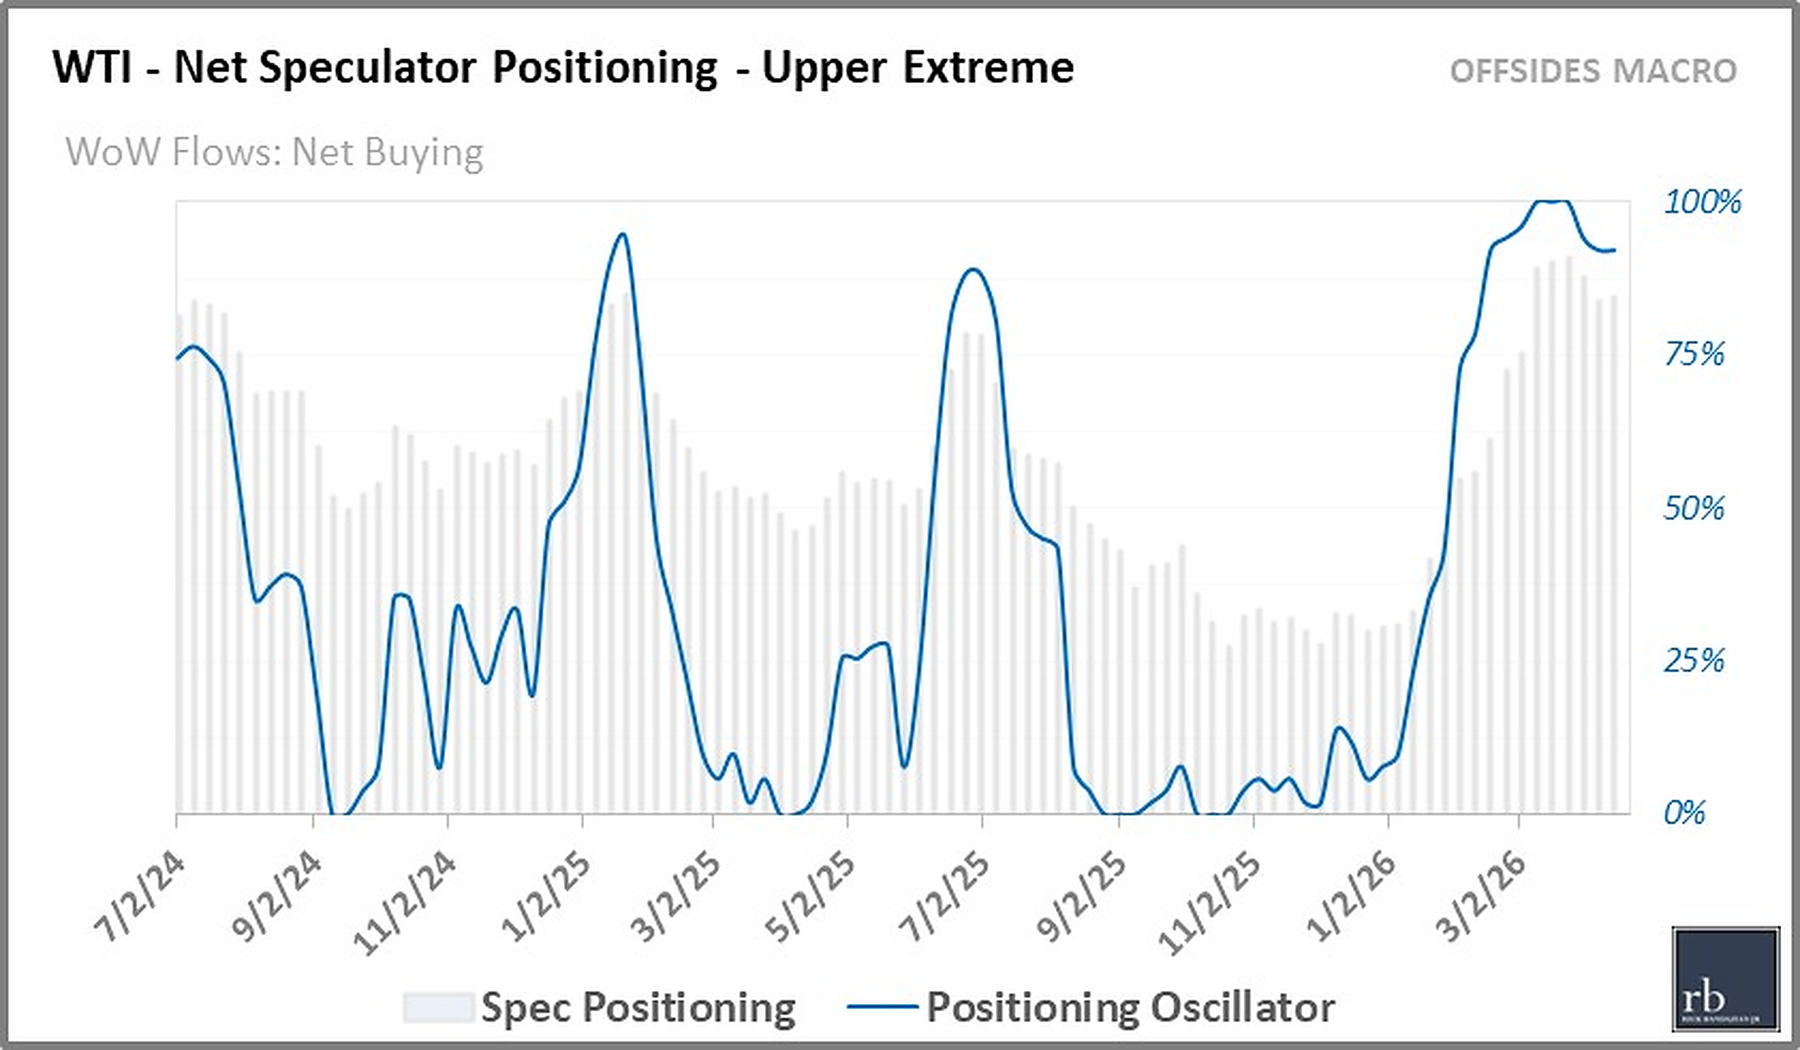
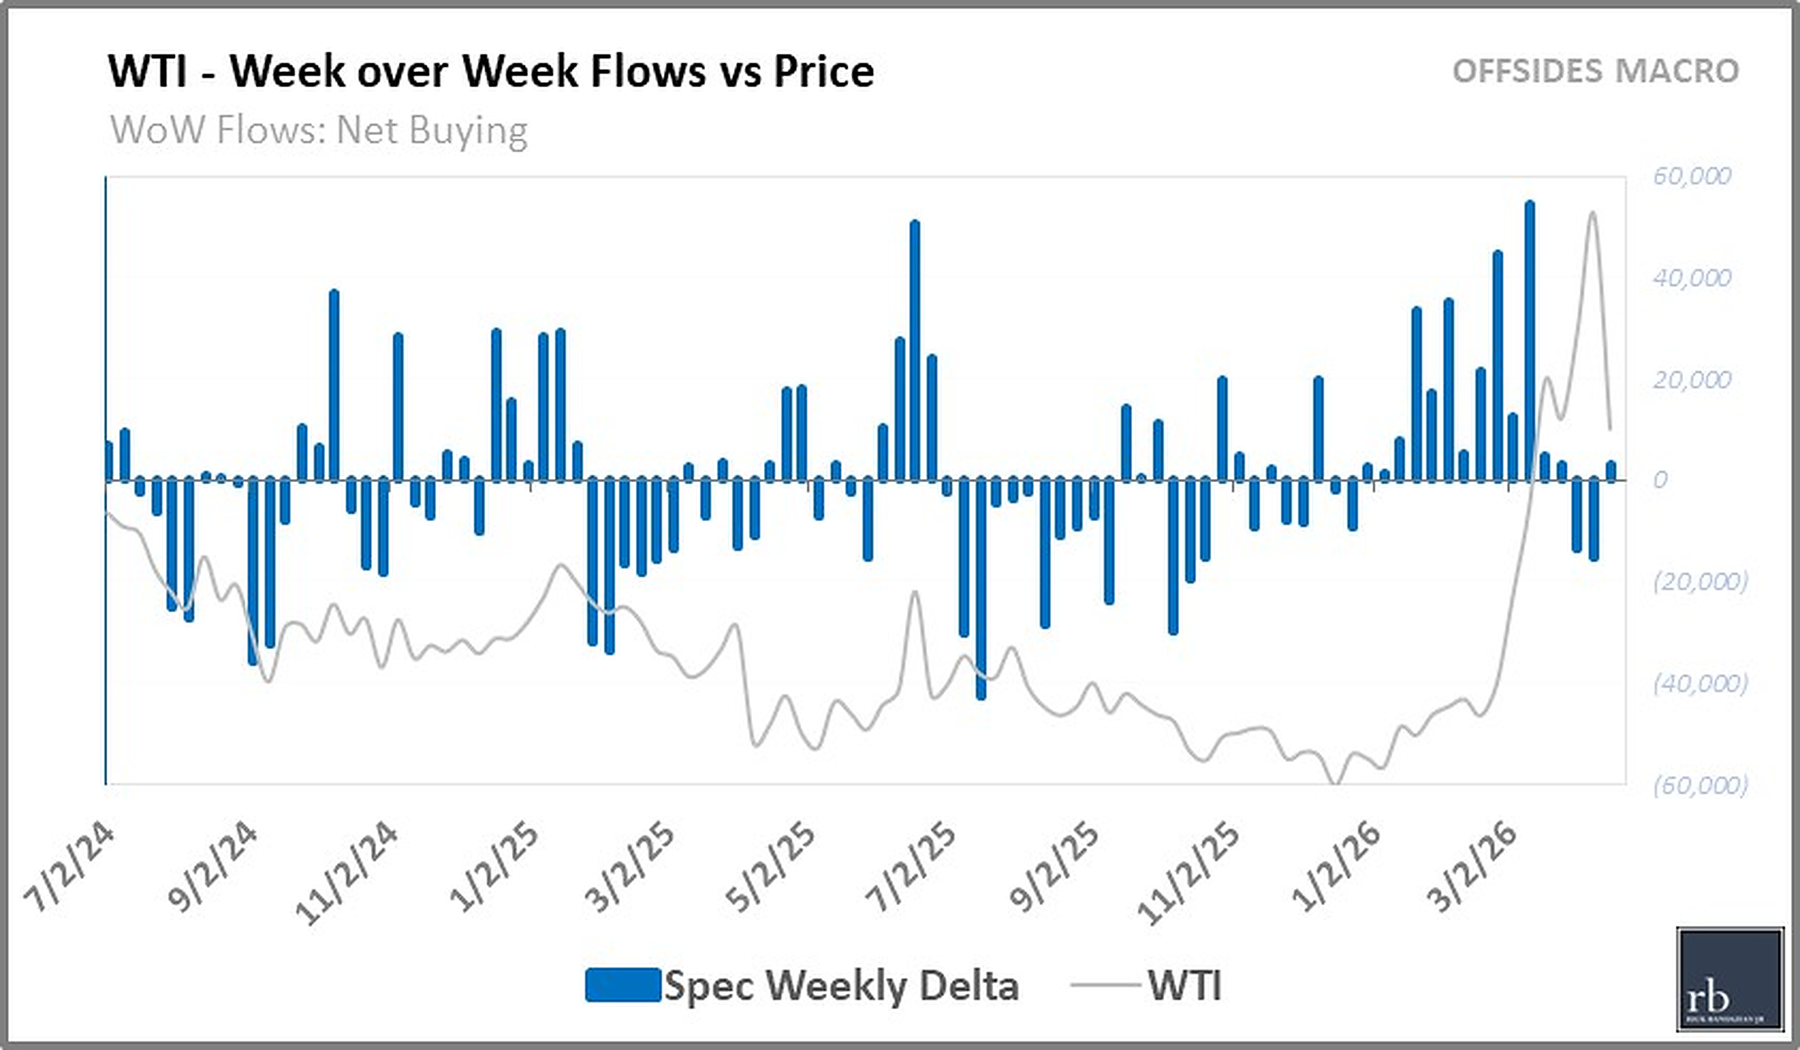
WTI surprisingly remains in Upper Extremes with week-over-week net-buying flows (however, this data does not reflect Friday’s trading). Nat Gas re-entered Lower Extreme positioning as net-selling flows continue to have a “drying up” direction since January. Positioning in RBOB and Heating Oil have led the way and are now in Neutral and lower quartile positioning, respectively.
| Instrument | Positioning %ile | Wk over Wk | Positioning Regime |
|---|---|---|---|
| WTI | 92%ile | ▶︎ | Upper Extreme |
| NatGas | 10%ile | ▼ | Lower Extreme |
| RBOB | 55%ile | ▼ | Neutral |
| Heating Oil | 22%ile | ▼ | Lower Quartile |
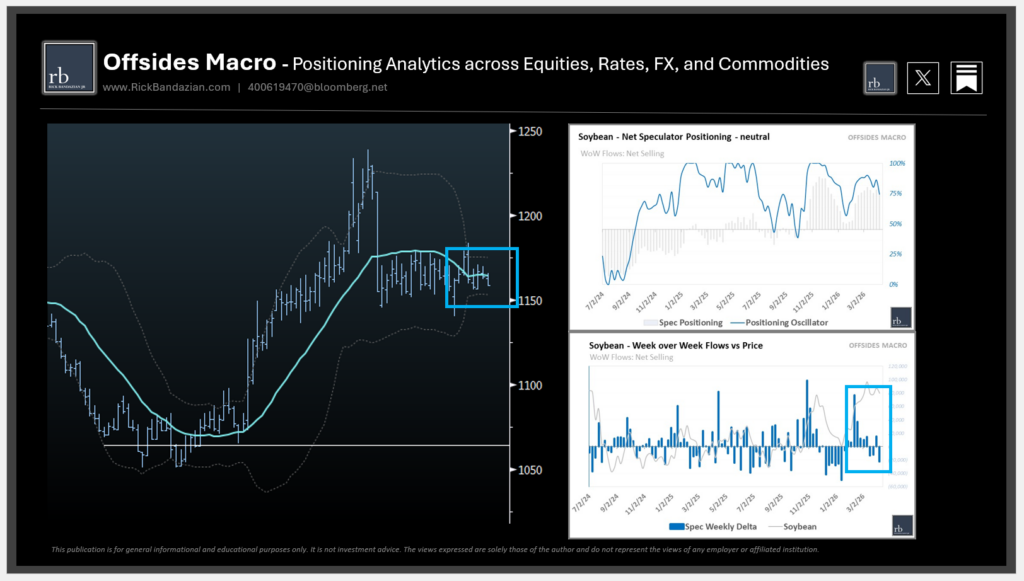
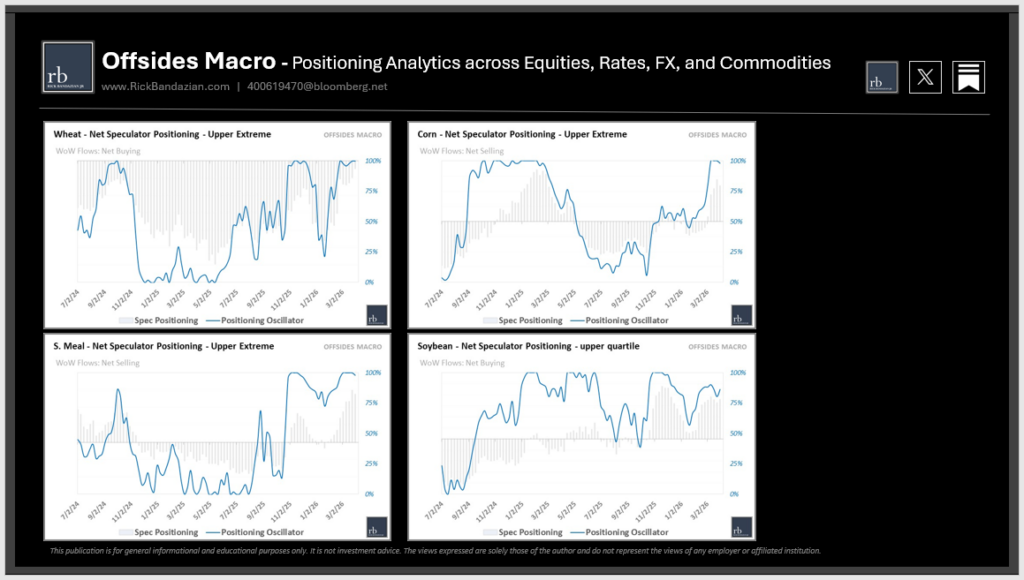
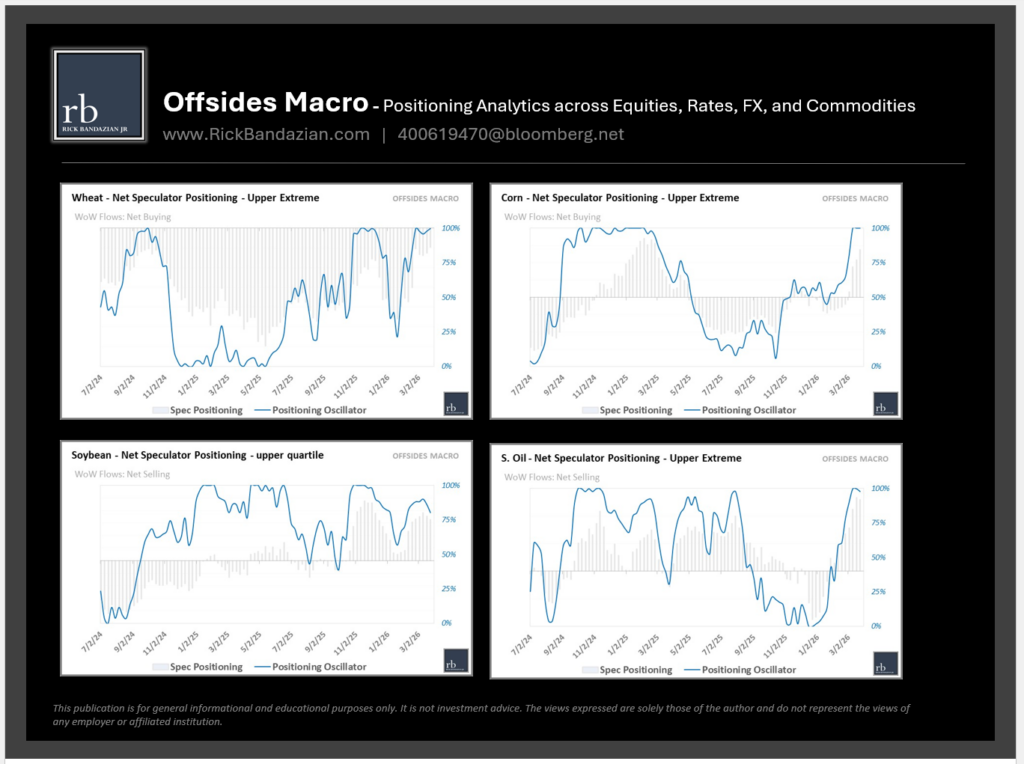
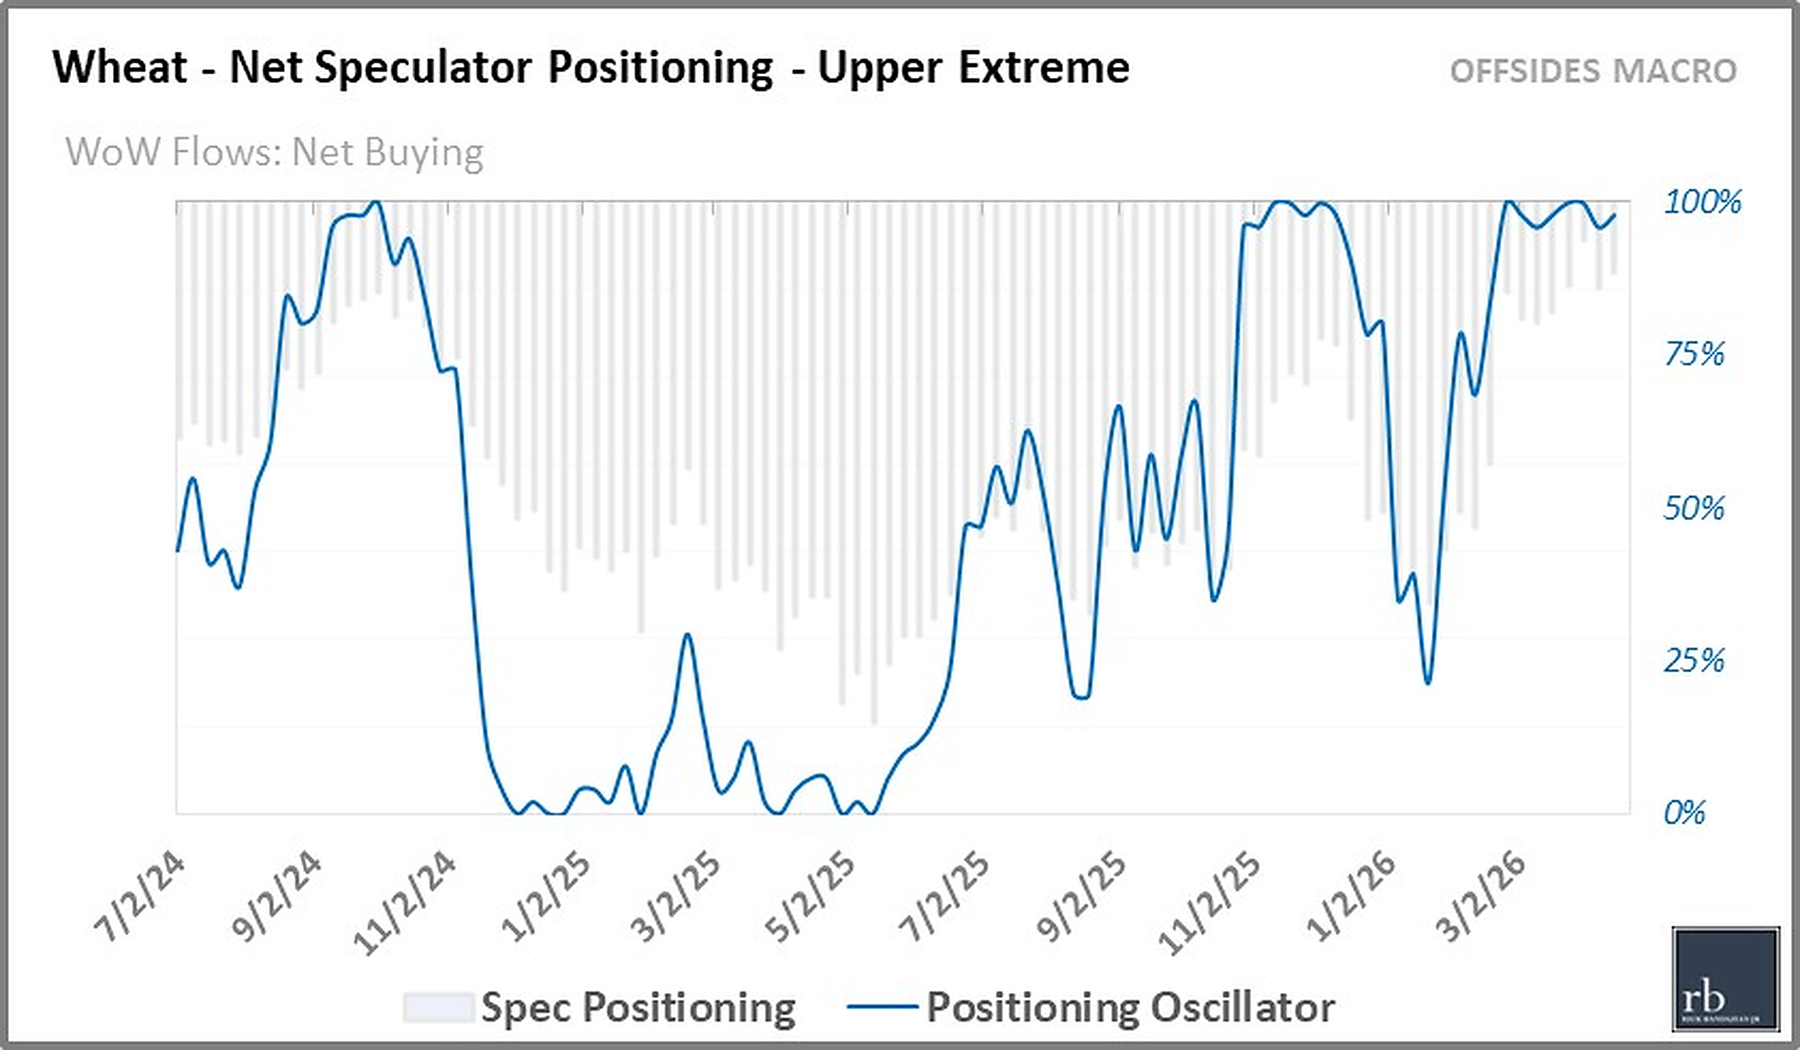
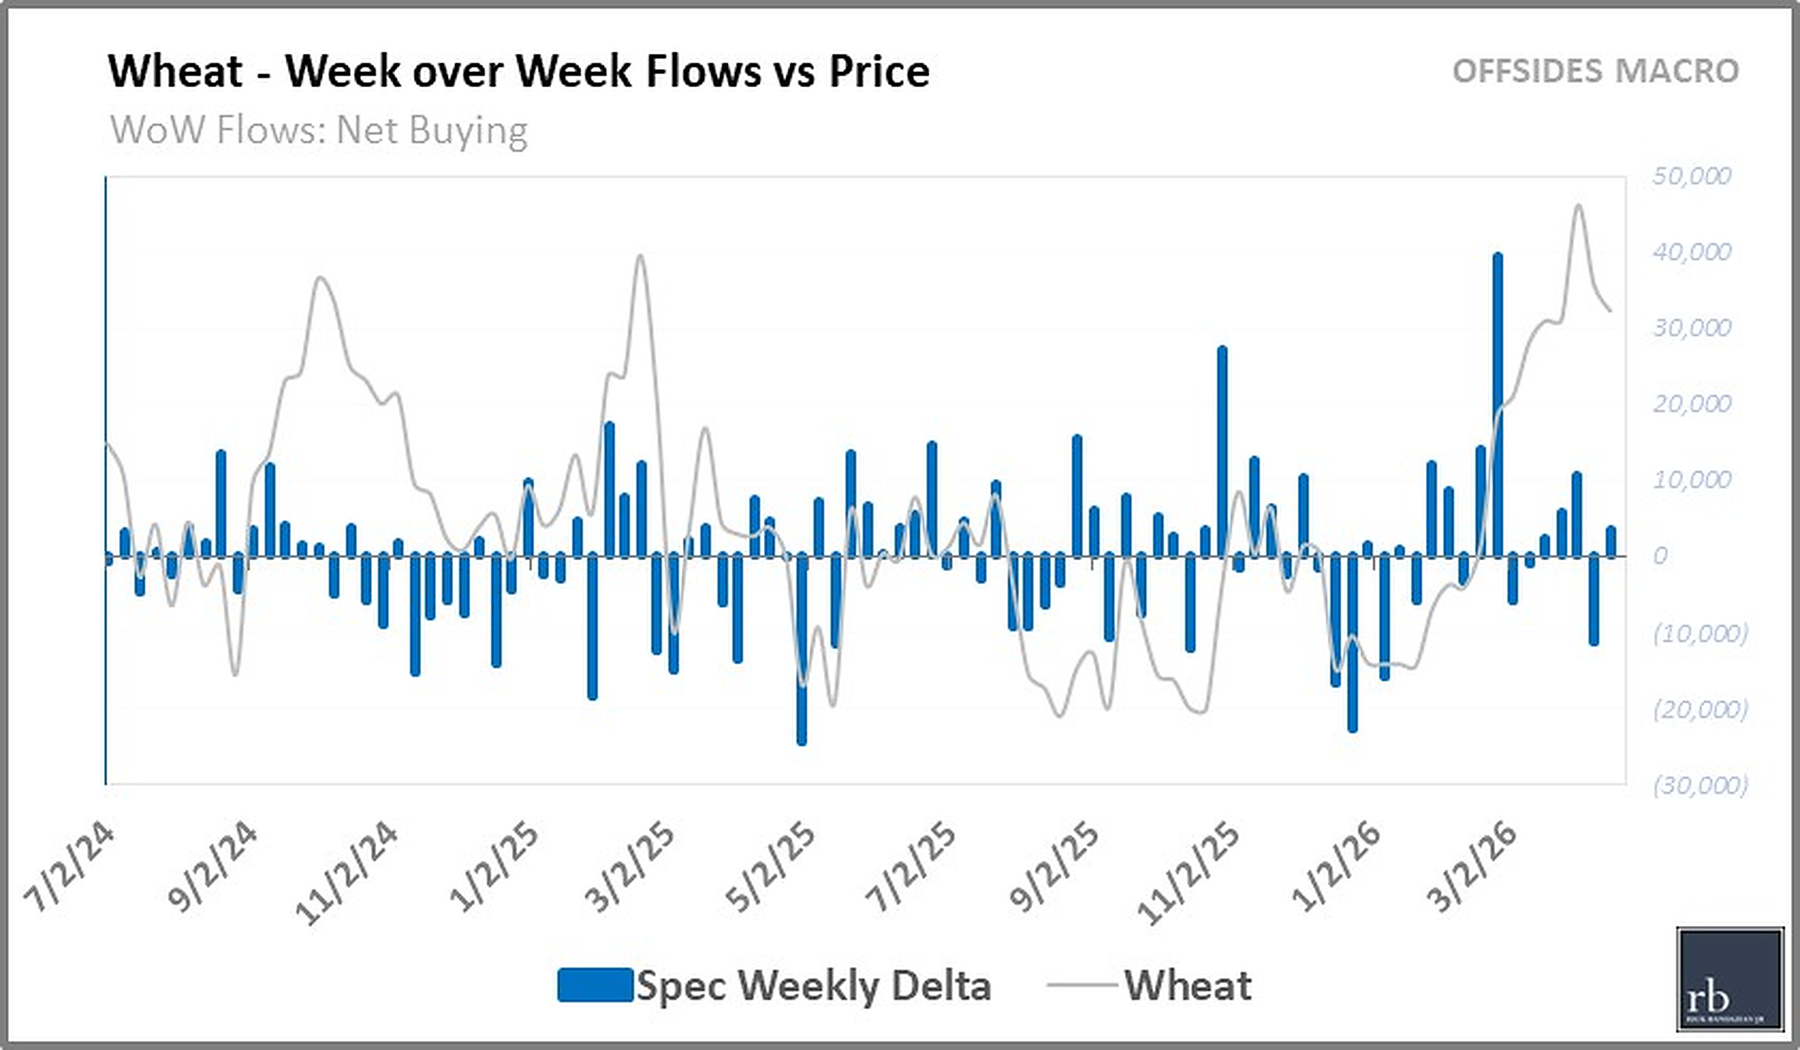
The Grains remain in a Risk-Off opportunity bias still hovering well into the upper quartile. Corn and Soybeans display the highest vulnerability with net-selling flows the past 2-3 weeks and lower trending positioning oscillators.
| Instrument | Positioning %ile | Wk over Wk | Positioning Regime |
|---|---|---|---|
| Wheat | 98%ile | ▲ | Upper Extreme |
| Corn | 90%ile | ▼ | Upper Extreme |
| Soybean | 71%ile | ▼ | Neutral |
| S. Oil | 98%ile | ▼ | Upper Extreme |
| S. Meal | 100%ile | ▲ | Upper Extreme |
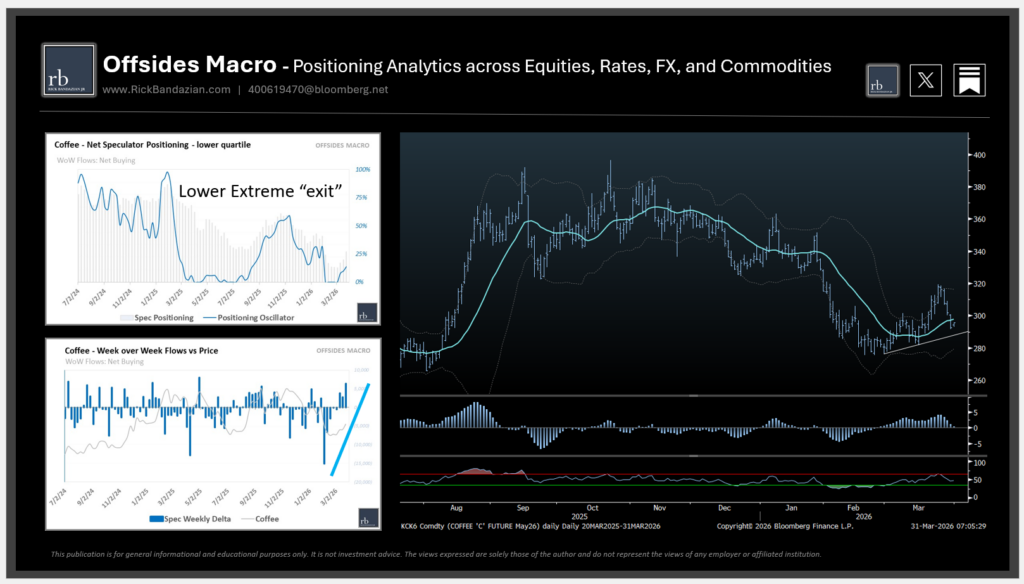
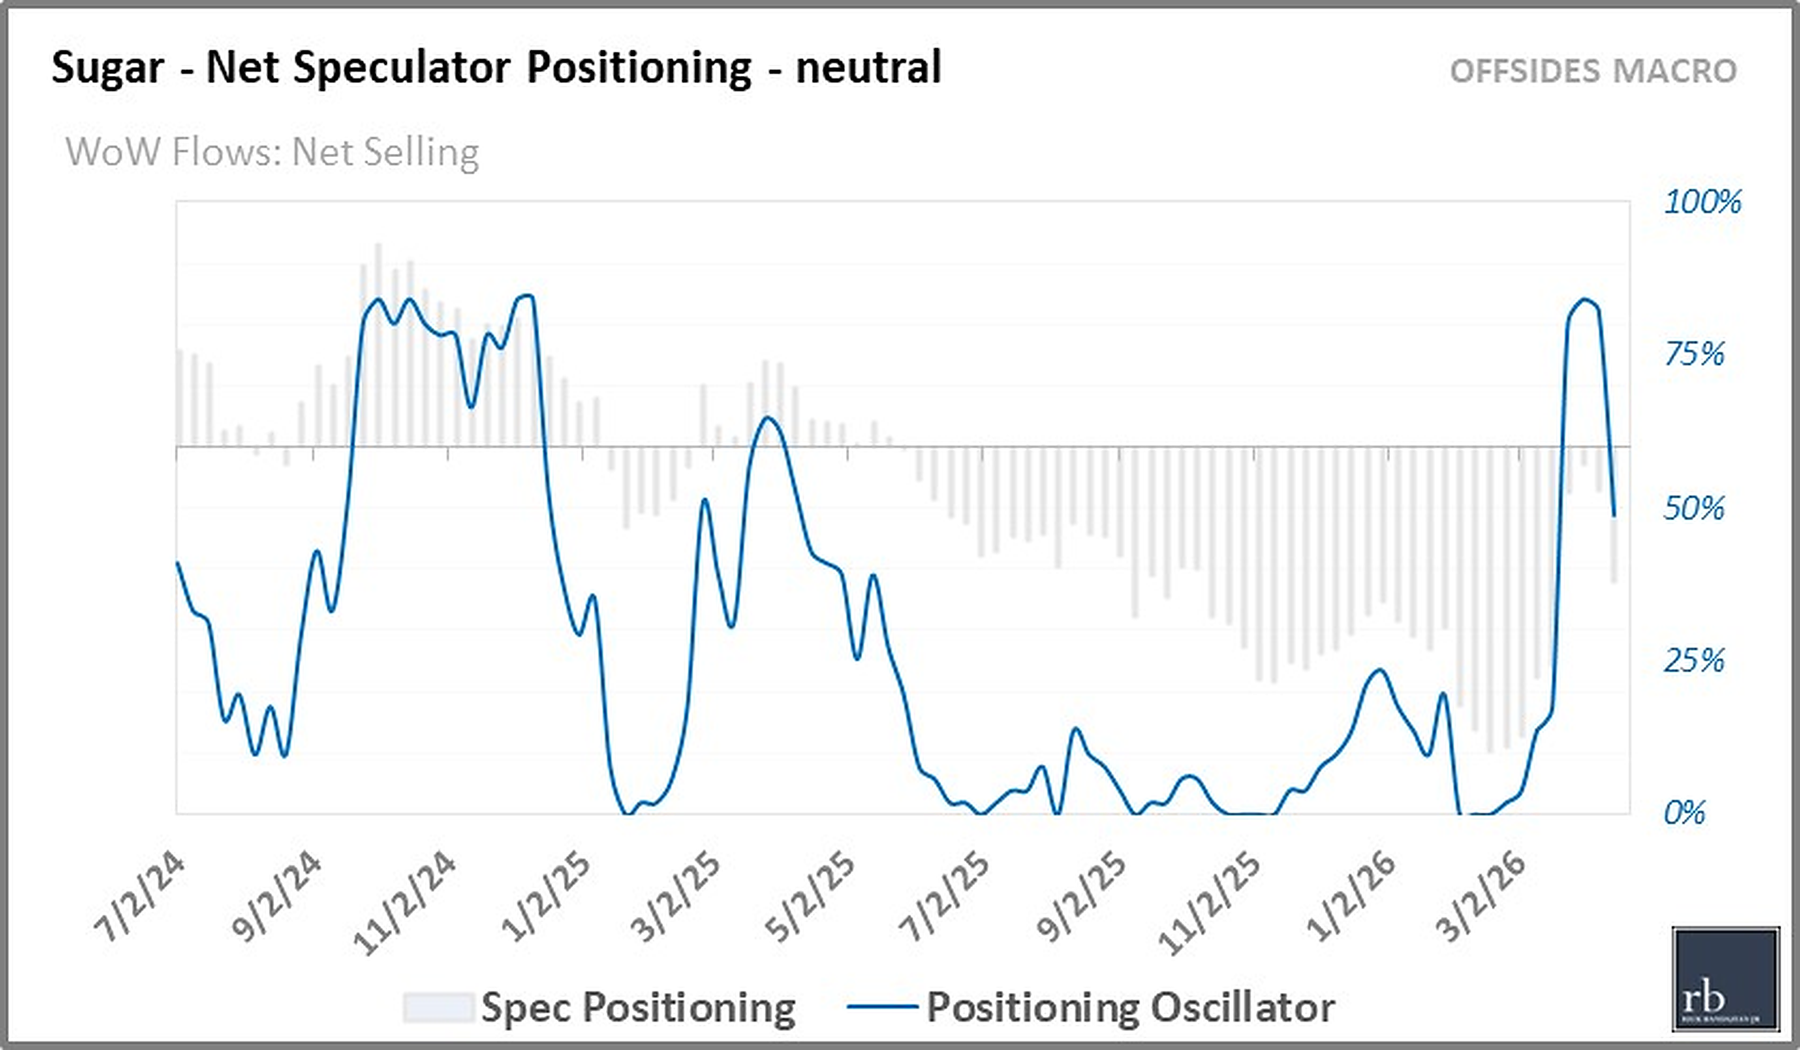
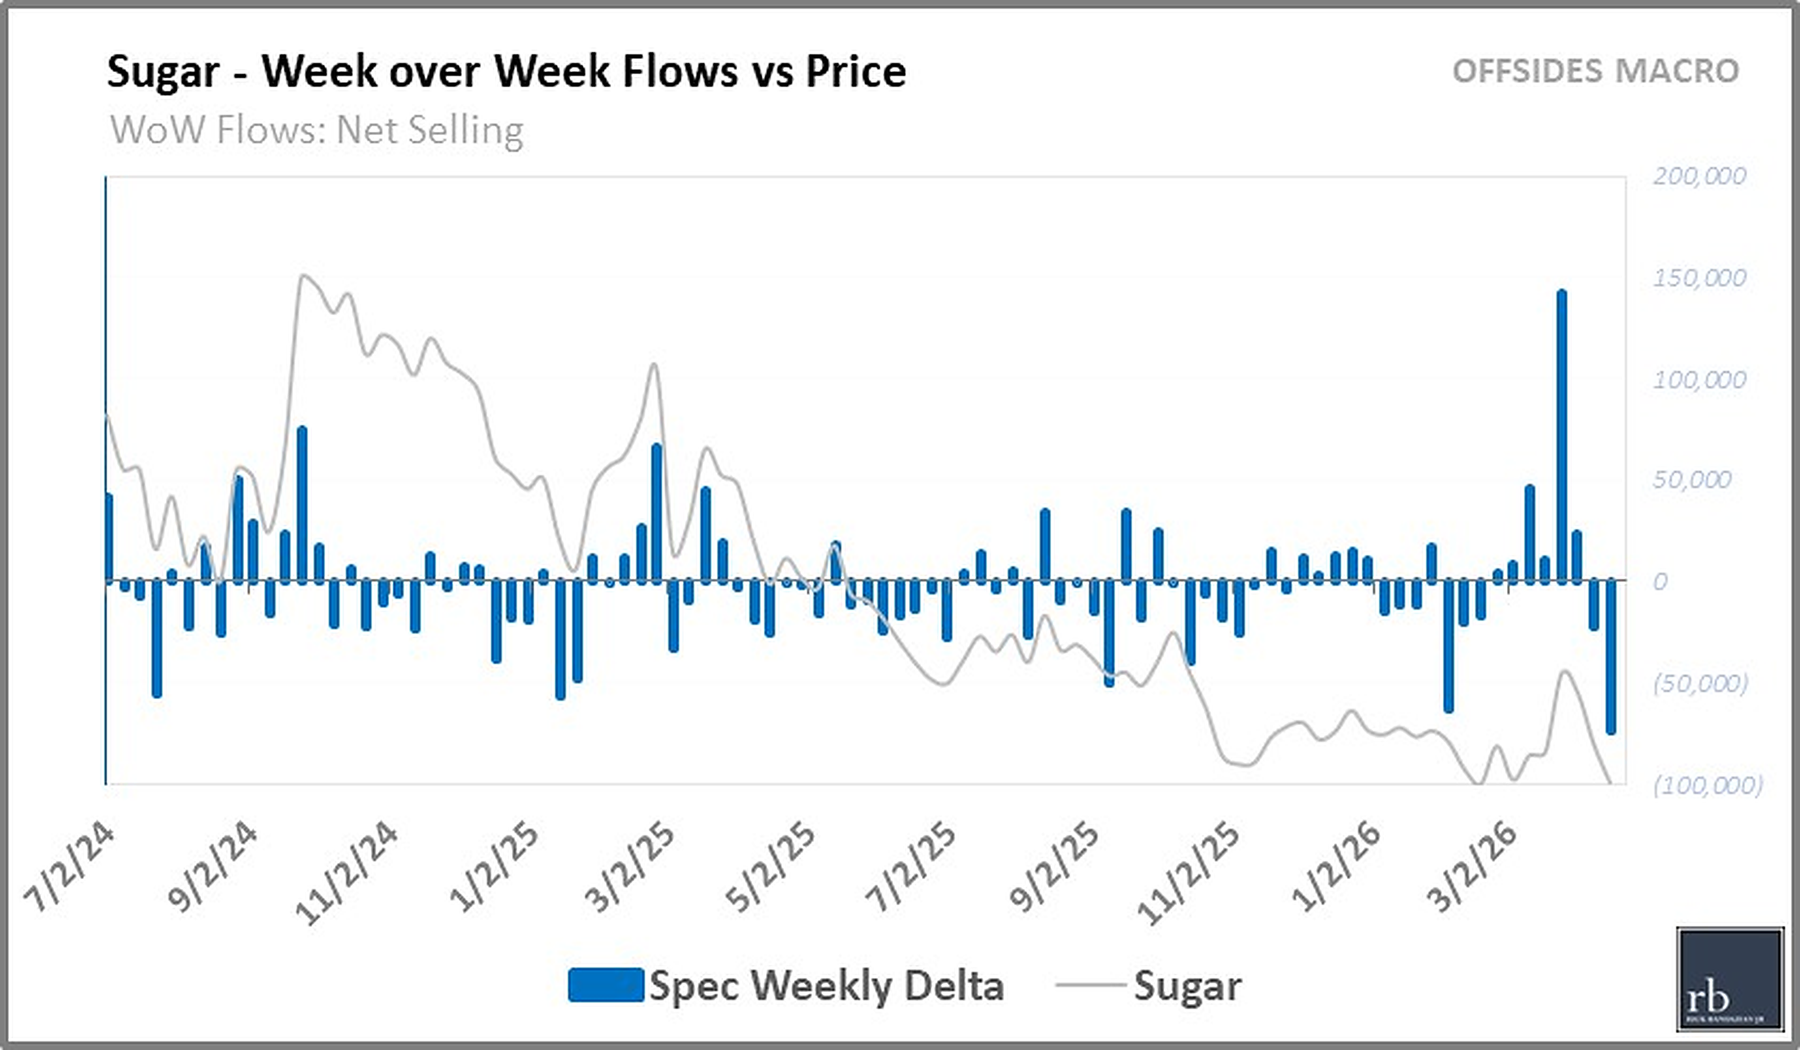
Cocoa positioning remains in Max Lower Extreme territory (highest net-short reading in past 18+months) as it oscillates between 3,100 and 3,700 (Jul contract). Of note: volatility has tightened dramatically over the last 45 days – a break out aligned with Offsides positioning could be violent. Coffee positioning is slowly climbing higher within the lower quartile. Cotton positioning remains in Upper Extreme territory nearing 2-year highs.
| Instrument | Positioning %ile | Wk over Wk | Positioning Regime |
|---|---|---|---|
| Sugar | 49%ile | ▼ | Neutral |
| Cocoa | 0%ile | ▶︎ | Lower Extreme |
| Coffee | 16%ile | ▲ | Lower Quartile |
| Cotton | 100%ile | ▶︎ | Upper Extreme |
| OJ | 100%ile | ▲ | Upper Extreme |
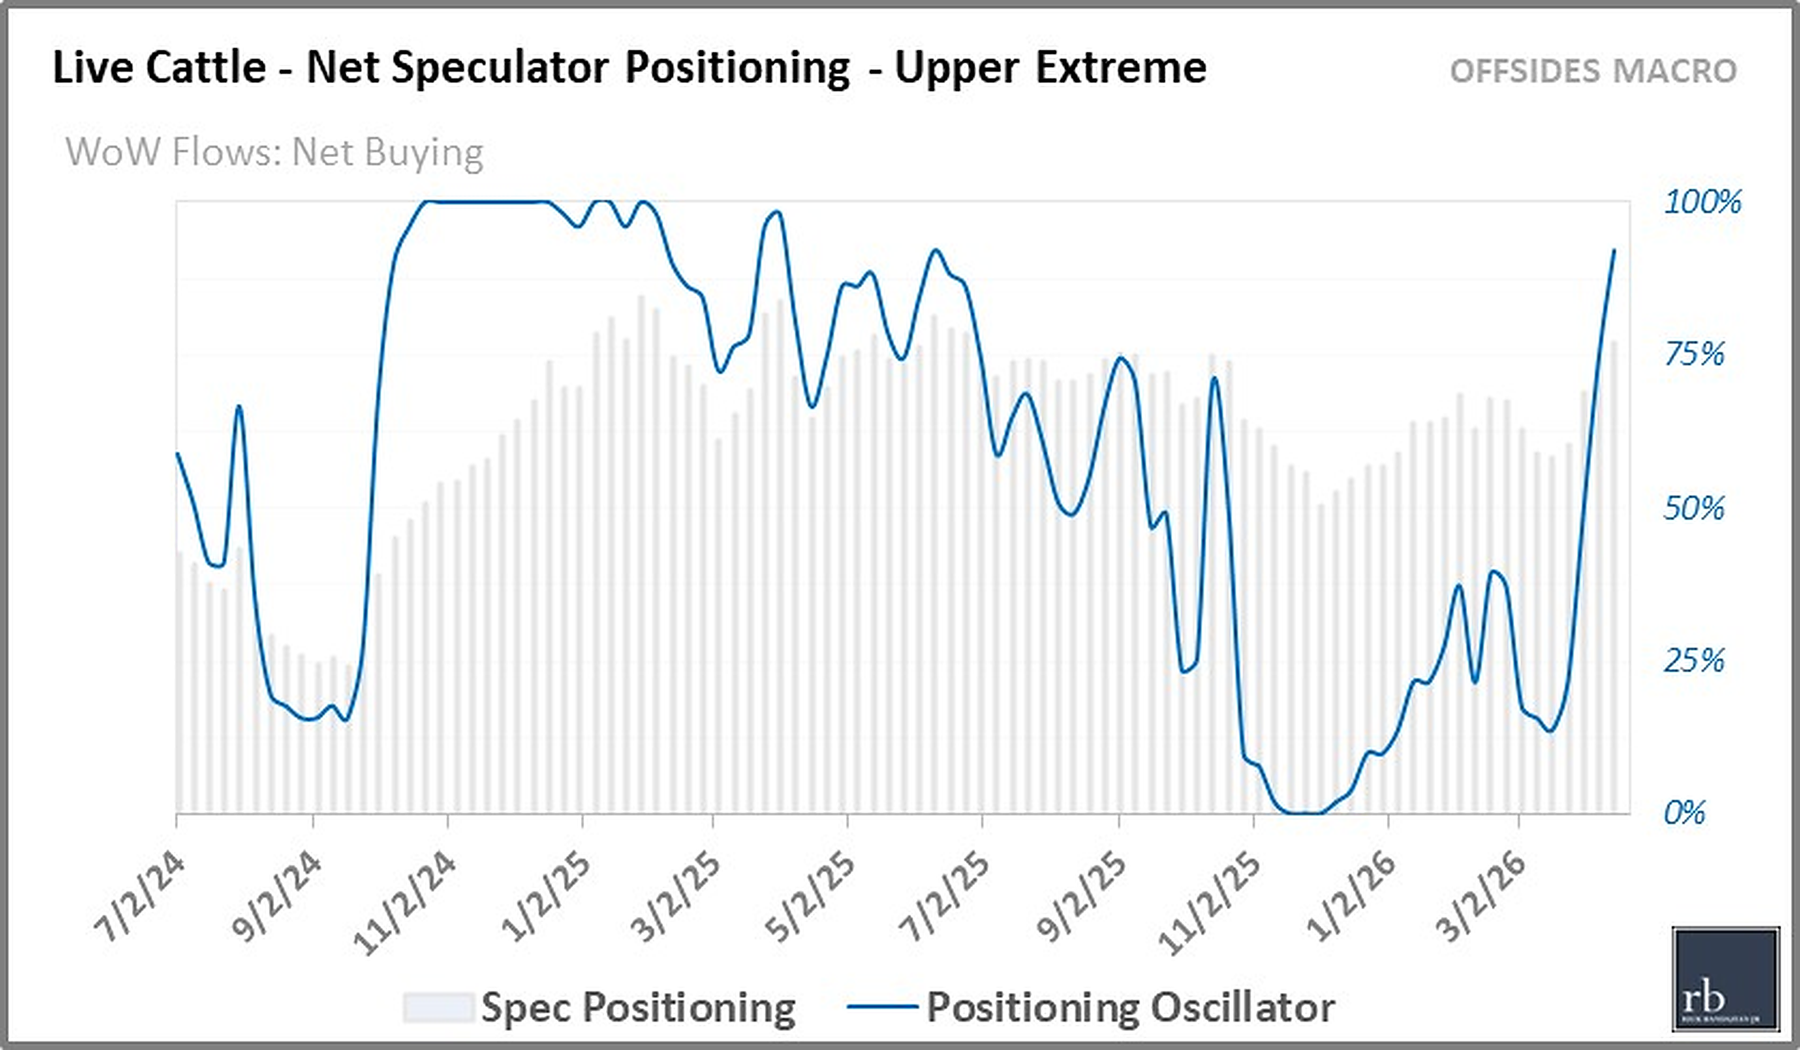
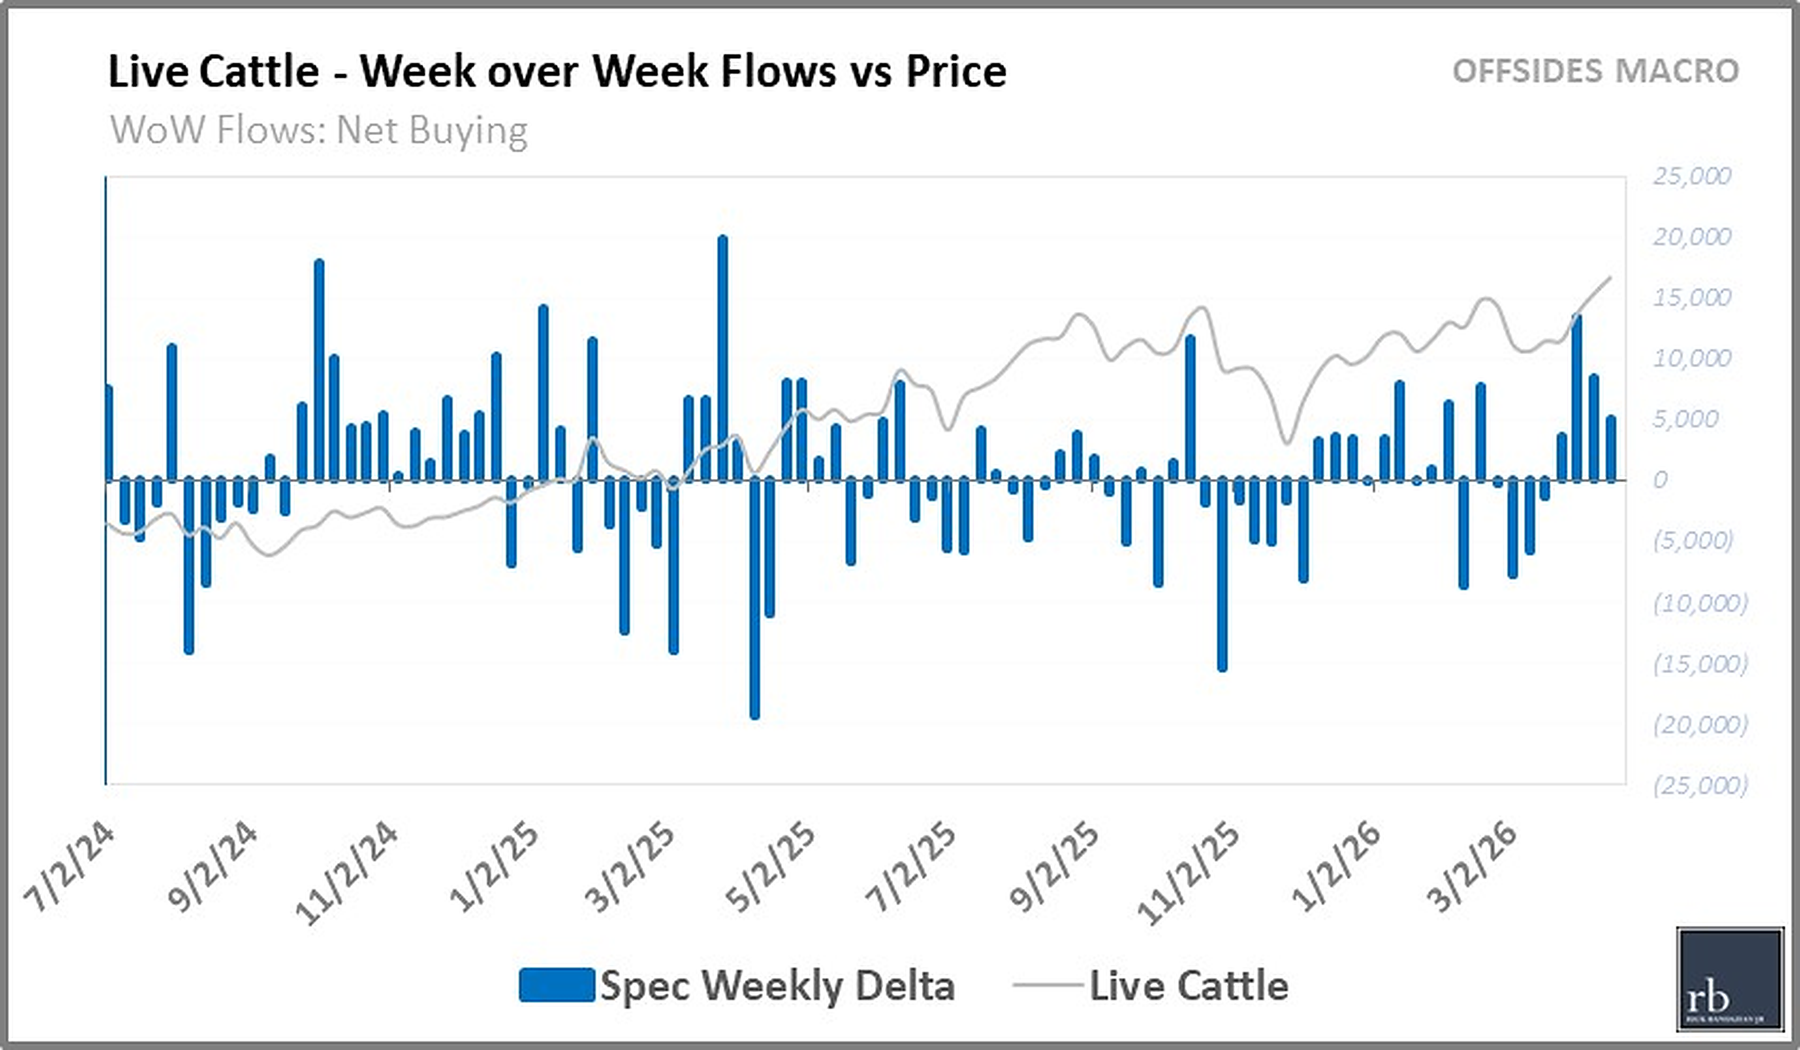
We’re now seeing a dispersion in Livestock with Live Cattle now back in Upper Extreme territory after 4 straight weeks of net-buying. Lean Hogs have now re-entered the lower quartile.
| Instrument | Positioning %ile | Wk over Wk | Positioning Regime |
|---|---|---|---|
| Live Cattle | 92%ile | ▲ | Upper Extreme |
| Lean Hogs | 18%ile | ▼ | Lower Quartile |
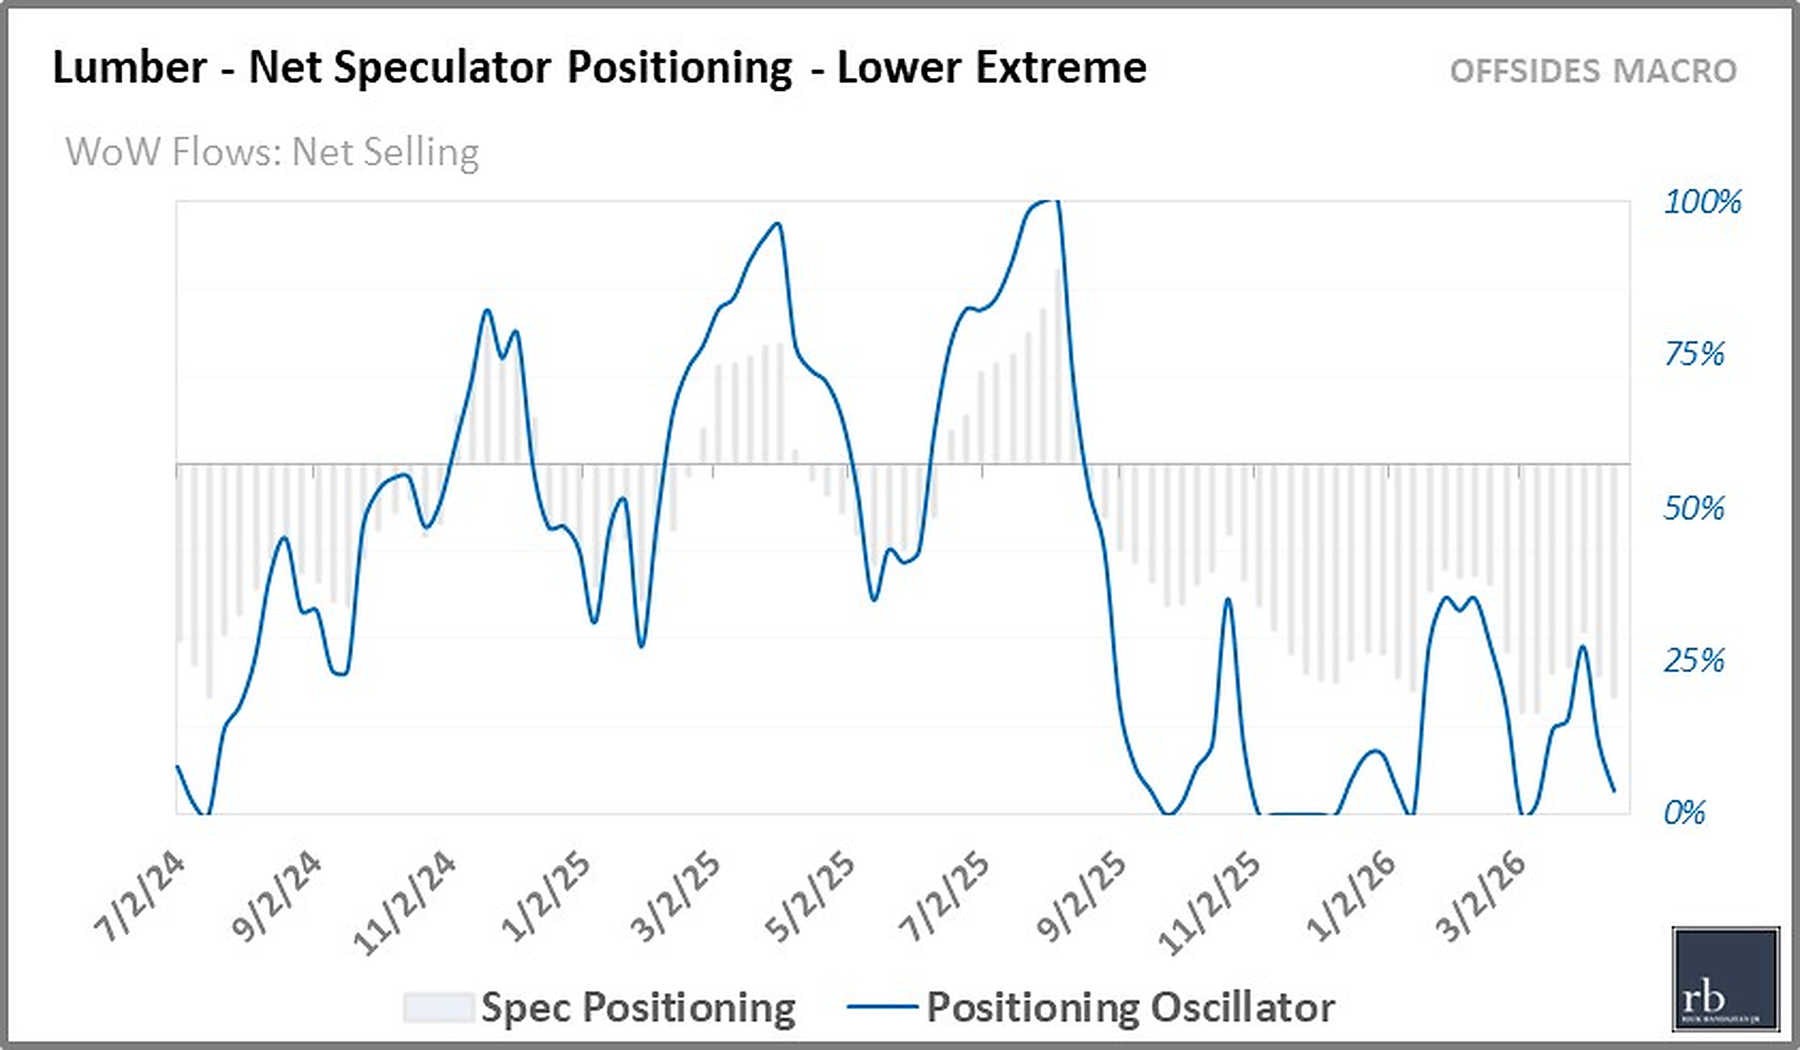
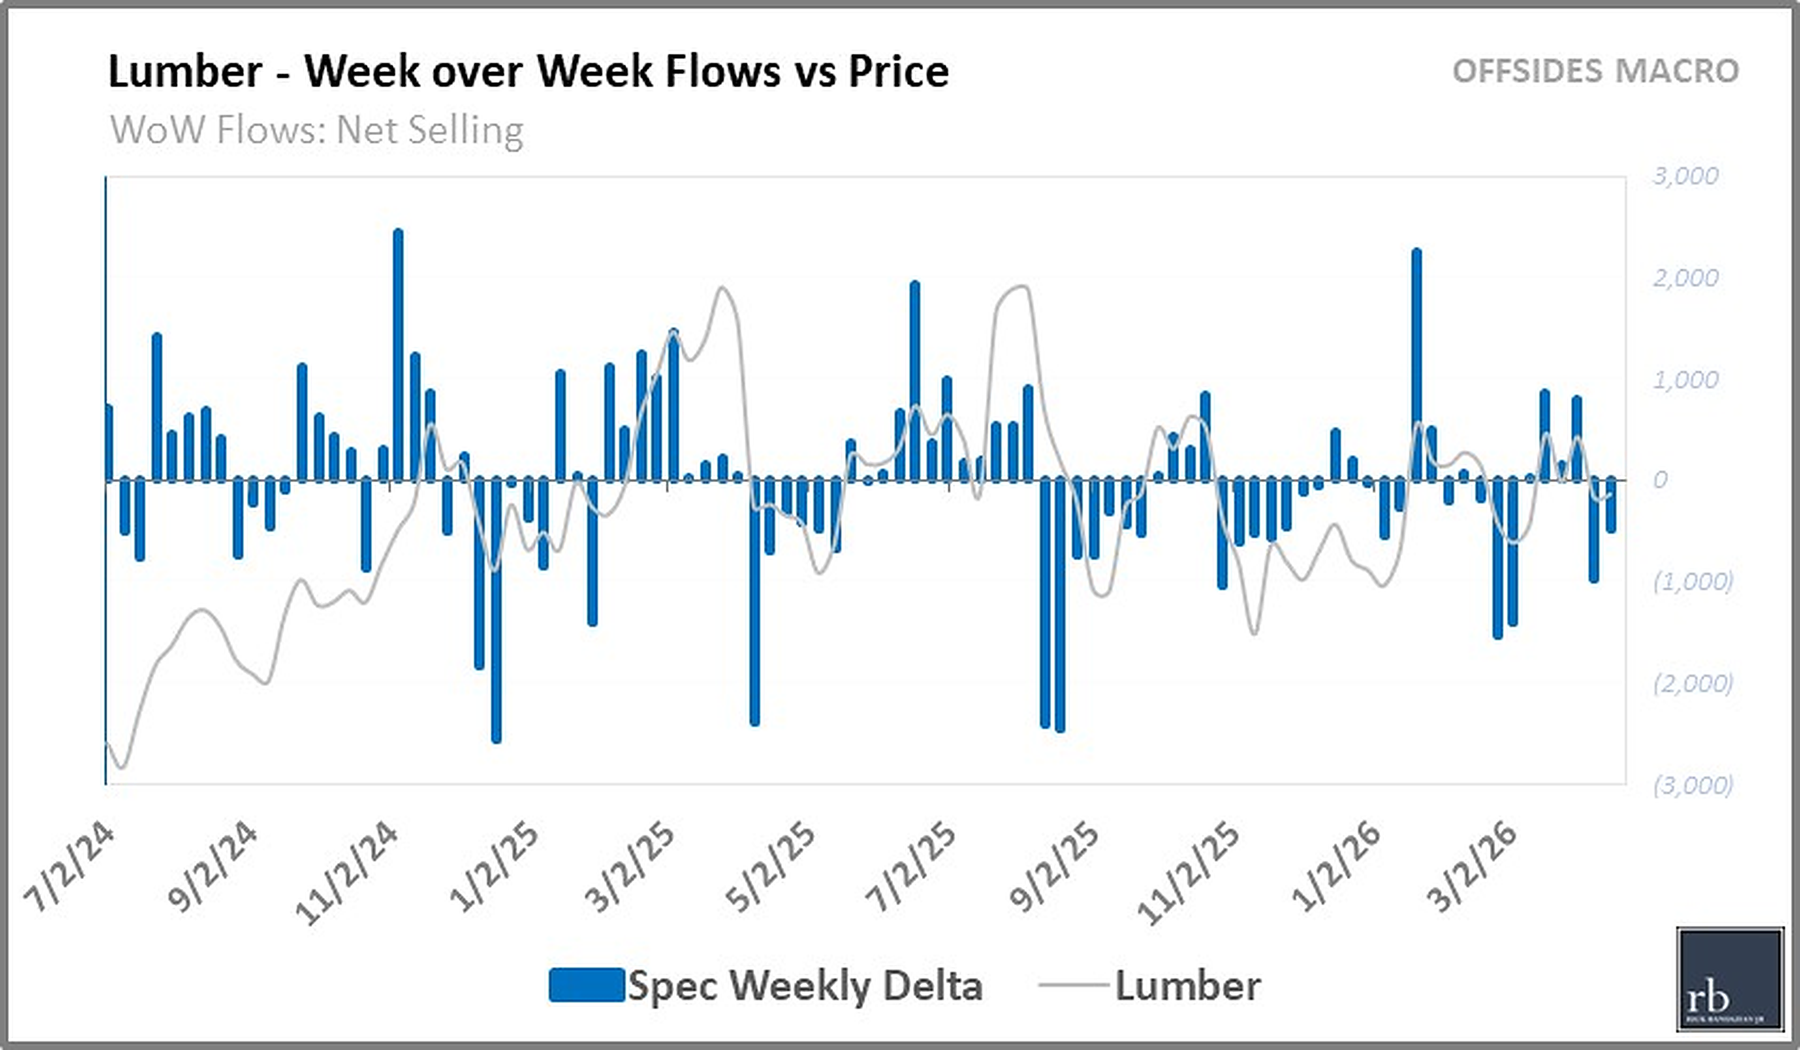
As I wrote in my White Paper — Offsides Positioning as a Factor in Systematic and Discretionary Macro 2026 — markets such as Crypto, FCOJ, Lumber, etc with lower liquidity, structurally distorted positioning, or insufficiently mature datasets are excluded given lower confidence levels. However, here is the Oscillator and Week over Week flows charts.
| Instrument | Positioning %ile | Wk over Wk | Positioning Regime |
|---|---|---|---|
| Lumber | 4%ile | ▼ | Lower Extreme |

Equities surprisingly pulled back to below neutral (largely driven by heavy net-selling S&P flows). Nasdaq and EEM remain the preferred risk-on vehicles with positioning in the lower quartile and Lower Extreme territories, respectively. Russell positioning is rising and nearing the upper quartile.